HP E1433A User's Guide
Using the HP E1433A
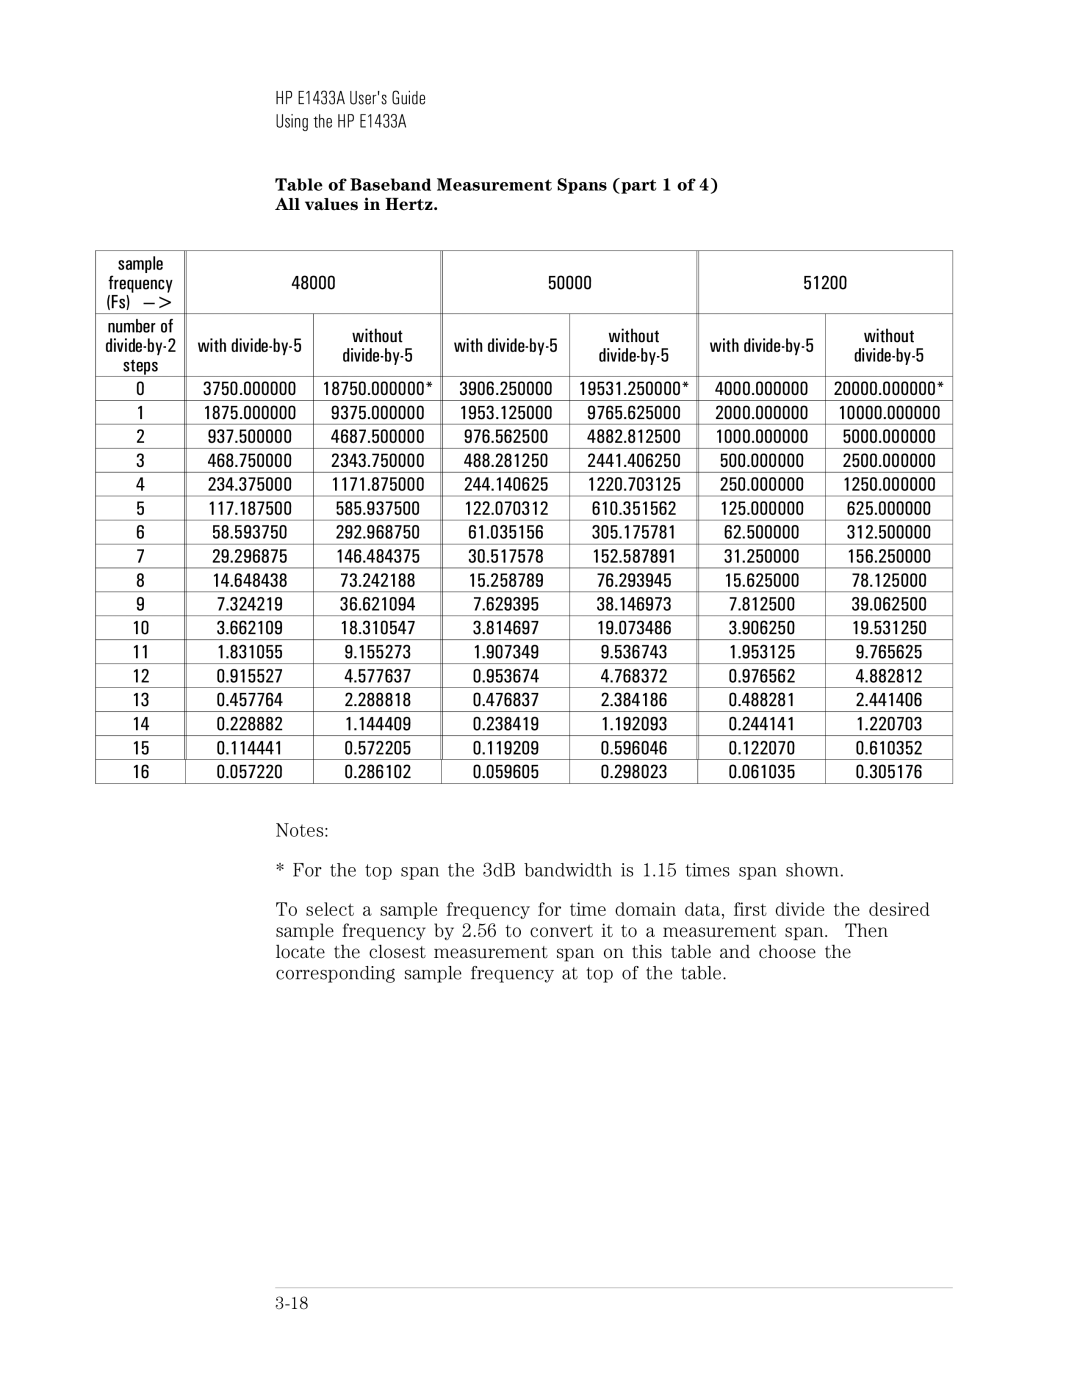
Table of Baseband Measurement Spans (part 1 of 4)
All values in Hertz.
sample |
|
|
|
|
|
| |
frequency | 48000 | 50000 | 51200 | ||||
(Fs) |
|
|
|
|
|
| |
number of |
| without |
| without |
| without | |
with | with | with | |||||
steps |
|
|
| ||||
|
|
|
|
|
| ||
0 | 3750.000000 | 18750.000000* | 3906.250000 | 19531.250000* | 4000.000000 | 20000.000000* | |
1 | 1875.000000 | 9375.000000 | 1953.125000 | 9765.625000 | 2000.000000 | 10000.000000 | |
2 | 937.500000 | 4687.500000 | 976.562500 | 4882.812500 | 1000.000000 | 5000.000000 | |
3 | 468.750000 | 2343.750000 | 488.281250 | 2441.406250 | 500.000000 | 2500.000000 | |
4 | 234.375000 | 1171.875000 | 244.140625 | 1220.703125 | 250.000000 | 1250.000000 | |
5 | 117.187500 | 585.937500 | 122.070312 | 610.351562 | 125.000000 | 625.000000 | |
6 | 58.593750 | 292.968750 | 61.035156 | 305.175781 | 62.500000 | 312.500000 | |
7 | 29.296875 | 146.484375 | 30.517578 | 152.587891 | 31.250000 | 156.250000 | |
8 | 14.648438 | 73.242188 | 15.258789 | 76.293945 | 15.625000 | 78.125000 | |
9 | 7.324219 | 36.621094 | 7.629395 | 38.146973 | 7.812500 | 39.062500 | |
10 | 3.662109 | 18.310547 | 3.814697 | 19.073486 | 3.906250 | 19.531250 | |
11 | 1.831055 | 9.155273 | 1.907349 | 9.536743 | 1.953125 | 9.765625 | |
12 | 0.915527 | 4.577637 | 0.953674 | 4.768372 | 0.976562 | 4.882812 | |
13 | 0.457764 | 2.288818 | 0.476837 | 2.384186 | 0.488281 | 2.441406 | |
14 | 0.228882 | 1.144409 | 0.238419 | 1.192093 | 0.244141 | 1.220703 | |
15 | 0.114441 | 0.572205 | 0.119209 | 0.596046 | 0.122070 | 0.610352 | |
16 | 0.057220 | 0.286102 | 0.059605 | 0.298023 | 0.061035 | 0.305176 | |
Notes:
* For the top span the 3dB bandwidth is 1.15 times span shown.
To select a sample frequency for time domain data, first divide the desired sample frequency by 2.56 to convert it to a measurement span. Then locate the closest measurement span on this table and choose the corresponding sample frequency at top of the table.
