HP Prime Graphing Calculator
User Guide
Edition1 Part Number NW280-2001 Legal Notices
Product Regulatory & Environment Information
Printing History
Edition
July
Page
Contents
Application Library App views Symbolic view
Plot view
Common operations in Plot view Zoom Trace
Function app
233
Computed statistics
Getting started with the Parametric app 271
Getting started with the Polar app 277
Variables
Lists
Basic integer arithmetic
Status messages
Preface
Manual conventions
Function, Polar, Parametric, Ans, etc
Getting started
Before starting
On/off, cancel operations
Display
Sections of the display
Lowercase when a key is pressed
Be entered in uppercase when a
Uppercase when a key is pressed
You are working in CAS view, not
Navigation
Touch gestures
Keyboard
Context-sensitive menu
Entry and edit keys
Primary entry and edit keys are
Ean operators
Minute, or second symbol accord
Comparison operators and Bool
Characters
Shift keys
Adding text
Math keys
Math template
Math shortcuts
Pressing ca third time will cycle back to
Fractions Hexagesimal numbers
236…. Press conce to see 219602 and again to see
Original decimal representation
EEX key powers
Return home H Enter 4BQ13 s6B23n 3BQ5
Menus
To select from a menu
Input forms
Toolbox menus
Alternatively, select the field and tap
System-wide settings
Home settings
23E2 in Scientific
Becomes 123.46
Fixed 2 format
Becomes 1.23E9 in Engineer
Or a+b*i
Menus are presented descriptively
Commands on the Math and CAS
Shorthand. The default is to provide
Or in common mathematical
YYYY/MM/DD, DD/MM/YYYY, or
MM/DD/YYYY
Specifying a Home setting
Press SH Settings to open
Mathematical calculations
Where to start
Always one-dimensional
Choosing an entry type
RPN Reverse Polish Notation. Not available in CAS view
Examples that follow assume that the entry mode is
Entering expressions
Textbook
Example Parentheses
R23jw14S j8nQ3 h45E
E45+Sz
Negative numbers
Algebraic precedence
Sj85s9
Reusing previous expressions and results
Explicit and implied multiplication Large results
Using the clipboard
To reuse the last
Result
Storing a value in a variable
Sj2E
SjS+E
Szj AaE
Szj AQAcE
Example To assign π2 to to the variable a
Complex numbers
Sharing data
R2o3 Ay6E
When is tapped
HP Prime to another
Online Help
Reverse Polish Notation RPN
RPN Reverse Polish Notation
RPN is available in Home view, but not in CAS view
History in RPN mode
Results
Re-using
Sample calculations
SzX3
Reverse Polish Notation RPN
Manipulating the stack
Swap
Stack
Show an item Delete an item Delete all items
Computer algebra system CAS
CAS view
CAS calculations
Menu buttons in CAS view are Assigns an object to a variable
Asw2
Settings
2Asj+3
5Asjw6
Ments Radians or Degrees
Standard or Scientific or Engineering
Recursive Replacement
See also Recursive Evalua
Tion above
Computer algebra system CAS
Computer algebra system CAS
Exam Mode
Don’t want disabled are not selected
Modifying the default configuration
Press SH. The Home Settings screen appears Tap
Press O+ A+ c
Creating a new configuration
Before, the only base configuration will be Default Exam
Activating Exam Mode
To activate exam mode
Tap If a configuration other than Default
Modifying configurations
Cancelling exam mode
To change a configuration
To return to the default configuration
Deleting configurations
Tap Exam Mode screen appears
Exam Mode
An introduction to HP apps
Linear Solver
Equations
Solve Explore equations in one or more real
Application Library
To delete an app Other options
Confidence level, and select a type
Symbolic view
App views
Test
Symbolic Setup view
Symbolic view
Plot view
Solve
Plot Setup view
Test selected in Symbolic view
Numeric view
Advanced View a table of numbers generated by Graphing
Numeric Setup view
Symbolic view, and set the zoom factor
Advanced Specify the numbers to be calculated Graphing
4Szf n2f jE
Quick example
Open the app
N2f
Press P
Press SP Set the second θRNG field to 4π by entering
Press Pto return to Plot view and see the complete plot
Common operations in Symbolic view
Θ column to be 1. You set this up in the Numeric Setup view
Numeric View
Add a definition
Modify a definition
Definitional building blocks
From Home variables
F9X=X2+Statistics2Var.PredY6
Evaluate a dependent definition
Select or deselect a definition to explore
X2+X+ 2 *X2
Choose a color for plots
Delete a definition
Symbolic view Summary of menu buttons
Restore default settings
Common operations in Symbolic Setup view
Override system-wide settings
Press SYto open Symbolic Setup view
Common operations in Plot view
Zoom
Zoom factors Zoom options
Center on
By the X Zoom and Y Zoom settings
Zoom setting
Shortcut press w
Shows a representative piece of the plot
Given the supplied x axis settings. For
Graph with the original plot settings
Apps, autoscaling rescales both axes
Split-screen
Testing a
Zoom with
Viewing
Shown, tap
Out
Decimal
Square
Autoscale
Integer
Trace
Trig
To evaluate a definition To turn tracing on or off
Common operations in Plot Setup view
Configure Plot view
Plot view Summary of menu buttons
Sequence Only
Parametric Only
Polar only
Stats 1 Var only
Panning and zooming
Sets the initial range of the x-axis. Note
That here are two fields one for
Sets the initial range of the y-axis. Note
Graphing methods
Restore default settings
Common operations in Numeric view
Zoom options Zoom keys Zoom menu
Evaluating
Custom tables
Deleting data
Numeric view Summary of menu buttons
Start typing a new value Only visible if Numtype is set to
Select Ascending or Descending ,
Common operations in Numeric Setup view
Modifying Numeric Setup
Combining Plot and Numeric Views
Adding a note to an app
Creating an app
Fibonacci in this example
App functions and variables
Asjw5
Tap This opens a menu of app variables
Select Statistics 1Var results MeanX
Function app
Getting started with the Function app
Open the Function app ISelect
Open the Function app Define the expressions
Rdw1 jw3E
Function
Set up the plot Plot the functions
Trace a graph Change the scale
Display Numeric view Set up Numeric view
Display the Numeric Setup view SMSetup
To navigate around a table
Press SJClear to reset all the settings to their defaults
Explore Numeric view
Substituted the values in the X column for x
To access the zoom
To go directly to a value
Options
To find a root of the quadratic function
Analyzing functions
Display the Plot view menu
=or\
Functions
To find an
Intersection of two
Intersection
To find the slope of the quadratic function
To find the signed area between the two functions
Extremum
Function Variables
To find
Quadratic
Tap and select
Function Select Results and then the variable of interest
Summary of FCN operations
Named Extremum
Slope
Advanced Graphing app
Getting started with the Advanced Graphing app
+ n5
Open the app Define the open sentence
Jn2
ISelect Advanced Graphing
128 Advanced Graphing app
Advanced Graphing app 129
Inequalities, for example
You can move in any direction within
Region. Use this option for
Edge
Numeric view Display the Numeric view Explore Numeric view
Numeric Setup
Trace in Numeric view
Trace Edge
Sj3n2
Trace PoI
Plot Gallery
Exploring a plot from the Plot Gallery
Geometry
Getting started with the Geometry app
3seASsE
Plot Function
With plotfunc on the entry line, enter 3*sinx
More Tangent
Create a
Derivative point
Add some calculations
AbscissaGB,slopeGC
140
Point D is the point whose ordinate value matches
Plot view in detail
Derivative
Derivative changes by looking at a plot of it rather than
142
Hiding names
Selecting an
Object
Moving objects
Removing fill
Coloring objects
Filling objects
Undoing
Objects
Clearing an
Clearing all
Moving about
Plot view buttons and keys
Key Result in Plot view
Symbolic view in detail
Hiding an object
Re-ordering
Entries
Tap either To move it down the list or Move it up
Deleting an
Can delete an object in Symbolic view
Numeric view in detail
Tap Or press C To delete all objects, press SJ
Listing all
Enter radiusGC
152
Geometric objects
Points
More
Element 0 . . Notice
Line
Polygon
Ngon
Curve
Special
Triangle’s three vertices
Circumcircle is the circle
That passes through each
Thus enclosing the triangle
Special Locus places
Geometric transformations
Symmetry axis defined in step
Tap Select Reflection
Axis and press E. The object is reflected across
Given scale factor around a given point as center
Select Transform Rotation
GK,angleGK,GL,GM
164
Point
Geometry functions and commands
Symbolic view Cmds menu
Barycenter
Element
Center
Divisionpoint
Inter
Orthocenter
Isobarycenter
Midpoint
Point
Erase trace
Point2d
Stop trace
DrawSlp
Halfline
Bisector
Exbisector
Line
Perpenbisector
Medianline
Parallel
Medianlinepoint1, point2, point3
Tangent
Perpendicular
Segment
Draws a segment defined by its endpoints
Equilateral triangle0,6 draws an equilateral
Equilateraltriangle
Hexagon
Equilateral triangle0,6, v draws an equilateral
Parallelogram
Isoscelestriangle
Isopolygon
IsoscelestriangleGA, GB, angleGC, GA, GB
Rectangle
Polygon
Quadrilateral
Rhombus
Righttriangle
Square
Triangle
Conic
Circle
Circumcircle
CircumcircleGA, GB, GC draws the circle
Hyperbola
Ellipse
Excircle
Excirclepoint1, point2, point3
Locus
Transform
Incircle
Parabola
Reflection
Inversion
Projection
Draws the orthogonal projection of a point onto a curve
Translation
Rotation
Similarity
RotateGA, angleGB, GC, GD,GK rotates
Measure Plot
Numeric view Cmds menu
Measure
ArcLen
Affix
Angle
Area
Distance2
Coordinates
Distance
Area4-x2/4, x=-4..4 returns 14.666…
Ordinate
Equation
Extractmeasure
Parameq
Iscollinear
Test
Radius
Isconcyclic
Isisoceles
Iselement
Isequilateral
Isorthogonal
Isperpendicular
Isparallel
Isparallelogram
Isrectangle
Convexhull
Other Geometry functions
Issquare
Harmonicconjugate
Isharmoniclinebundle
Isharmonic
Isharmoniccirclebundle
Isrhombus
Openpolygon
LineHorz
LineVert
Polar
Radicalaxis
Powerpc
Pole
Reciprocation
Vertices
Singleinter
Vector
Verticesabca
194
Spreadsheet
Getting started with the Spreadsheet app
To open the Spreadsheet app, press Iand select Spreadsheet
196
Select the heading cell for column C, tap and select
Select cell D1 Enter a formula to add up your takings
Select cell C3 Enter a label for your total commission
Select cell C5
Ancostse
Enter a label for your fixed costs
Basic operations
Navigation, selection and gestures
Cell references
Cell naming
Method
Entering content
Enter Cost and tap
COST*0.33 and tap
Enter Statistics1Var.D1
External functions
Select Polynomial Find Roots
To copy one or more cells, select them and press SVCopy
External references
Copy and paste
Format, both value and format, or both formula and format
Referencing variables
Using the CAS in spreadsheet calculations
= Row2-√Row-1. The only
Line is active
Buttons and keys
Handled by the CAS, but only Evaluates it
Changes to
Formatting options
Formatting options appear
Font Size Auto or from 10 to 22 point
Format Parameters
Spreadsheet functions
Statistics 1Var app
Getting started with the Statistics 1Var app
Statistics 1Var
Sample data in D1
Editing. Tap when done
Symbolic view menu items
Menu items you can tap on in Symbolic view are
Enters D directly to save you having to press two keys
214
Configure a histogram plot for the data Setup
Entering and editing statistical data
Spreadsheet.A1A10 D7 E
Edit a data set
1Var app open, return to Home view and enter
Menu items you can tap on in Numeric view are
Delete data Insert data Generating data Sort data values
Computed statistics
To plot statistical data
Plotting
Plot types
Histogram
Line plot
Box-and-Whisker
Normal probability
Bar graph
Exploring the graph
Setting up the plot Plot Setup view
Pareto chart
Data in descending
Plot view menu items
Menu items you can tap on in Plot view are
Advertising minutes Resulting sales $
Statistics 2Var app
Getting started with the Statistics 2Var app
Dependent, y
Statistics 2Var
Enter the advertising minutes data in column C1 2E1E3E5E5E4
Statistics 2Var app 225
Setup plot Plot the graph
Display the equation Predict values
Spreadsheet.A1A10 C7 E
Numeric view menu items
Buttons you can tap on in Numeric view are
Tap , make your change, and tap
Delete data Insert data Sort data values
Descending
Defining a regression model
Fit types
For growth. You can store a
Where L is the saturation value
Fits the data to a logistic curve
Positive real value in L, or-if
SCOV
COV
ΣXY
Plotting statistical data
SerrY
Tracing a scatter
Tracing a curve
Tracing order
Plotting mark
Plot setup
Plot view menu items
Connect
Predicting values
Home view
Troubleshooting a plot
Open
Inference app
Getting started with the Inference app
Inference
Symbolic view options
Test μ1 μ2, the T-Test on
Sample mean Sample size
Select the inference method Enter data
Test 1 μ from the Type menu
Population standard deviation Alpha level for the test
Display the test results Plot the test results
Importing statistics
Open the Statistics 1Var app Clear unwanted data Enter data
82.5 E 83.1 E 82.6 E 83.7 E 82.4 E 83 E
Tap on the Method field and select
Calculate statistics Open the Inference app
Select inference method and type Import the data
Confidence Interval
Results
Hypothesis tests
Display
Numerically
One-Sample Z-Test
Menu name
Inputs
Two-Sample Z-Test
One-Proportion Z-Test
Two-Proportion Z-Test
With the test Z-value
One-Sample T-Test
Test Z Test statistic Test Δ pˆ Difference between
This test measures the strength of the evidence for a
Two-Sample T-Test
Test μ1 μ2
Each sample from a different population, this test
Sample 1 standard deviation
Sample 2 standard deviation
Α level that you supplied
Confidence intervals
One-Sample Z-Interval
Two-Sample Z-Interval
Number of successes
One-Proportion Z-Interval
Int 1π
Sample success count Sample size Confidence level
Confidence interval for the difference between
Two-Proportion Z-Interval
Menu name Int π1 π2
Proportions of successes in two populations
One-Sample T-Interval
Two-Sample T-Interval
Result Definition
258
Solve app
Getting started with the Solve app
Clear the app and define the equation
One equation
Open the Solve app
AVjS.AU j+2AAAD
Enter known variables
Solve the unknown variable
Kph over a distance Is approximately 2.4692 m/s2
Select Auto Scale Select Both sides of En
Where n is the number of the selected equation
Plot the equation
Matches the value of a you calculated above
Several equations
Open the Solve app Define the equations Enter a seed value
AXj+AYj S.16E AXwAYS. Q1E
Limitations
Solve the unknown variables
Sign
Solution information
Zero
Reversal
Bad Guesses Constant?
No values satisfy the selected equation or expression
Value of the equation is the same at every point sampled
Open the Linear Solver app. ISelect
Linear Solver app
Getting started with the Linear Solver app
Linear Solver
Define and solve the equations
Coefficients and constants had been entered
Menu items
Solve a two-by- two system
270
Open the Parametric app
Parametric app
Getting started with the Parametric app
Parametric
Define the functions
8ed? 8fd?
Set the angle measure Set up the plot Plot the functions
Degrees
274
Tap .The table scrolls to the value you entered
276
Getting started with the Polar app
Open the Polar app ISelect Polar App opens in Symbolic view
Polar app
Open the Polar app
Set angle measure Set up the plot
5Szf dn2 fdj
Define the expression 5πcosθ/2cosθ2
Plot the expression Explore the graph
280 Polar app
Sequence app
Getting started with the Sequence app
Open the Sequence app ISelect
App opens in Symbolic view Define the Fibonacci sequence
+ E
Sequence
Plot the sequence
Select Stairstep from the Seq Plot menu
Display Numeric view Explore the table of values
Another example Explicitly-defined sequences
Set up the table of values
Define the expression Setup the plot
RQFand
Plot the sequence Explore the table of sequence values
Finance app
Getting Started with the Finance app
288
Cash flow diagrams
Time value of money TVM
TVM calculations Another example
PMT
292
Calculating amortizations
To calculate amortizations
Amortization graph
Finance app 295
Tapping
Triangle Solver app
Getting started with the Triangle Solver app
Open the Triangle Solver app ISelect
Specify the known values
Choosing triangle types
Solve for the unknown values
Special cases
Triangle Solver app 299
Explorer apps
Linear Explorer app
Graph mode
Between them by tapping or
Equation mode Tap to enter
Test mode
Quadratic
Quadratic Explorer app
Open the app
Explorer
Tap To see the correct answer and tap Exit Test mode
Equation mode
Its value. When you are ready, tap To see if you
Graphs that are harder match by tapping Respectively
Trig Explorer app
Trig Explorer
Cursor keys. All four keys
Tap To switch to
Graph by pressing
Are available.
Tap to see the correct answer and tap to exit Test mode
Now press the cursor keys to select each parameter
Functions and commands
All the functions and commands
308
Keyboard functions
Abbreviations used in this chapter
NORMALICDFμ,σ,p
E5 returns
+,w,s, n
Shex
ALOG3 returns
Efg
1returns
+2*i returns -1-2*i
2returns
Math menu
Numbers
Arithmetic
Example XPON123456 returns 5 since 105.0915... equals
Maximum Maximum. The greater of two values
Example ARG3+3*i returns 45 degrees mode
Modulus Modulo. The remainder of value1/value2
Percentage x percent of y that is, x/100*y Example
Trigonometry
Hyperbolic
Probability
PERM5,2returns
Normal Random real number with normal distribution Nμ,σ
NORMALD0.5 and NORMALD0,1,0.5 both return
RANDSEEDvalue
NORMALDμ,σ,x
STUDENTn,x
Is a real number
FISHERCDFn,d,x
CHISQUARECDFn,k
CHISQUARECDF2,6.1 returns
FISHERCDF5,5,2 returns
List
Matrix
Special
CAS menu
Algebra
Numera,b
Syntax substExpr,Var=value
PartfracRatFrac or Opt
Denoma/b
Calculus
DiffExpr,var DiffExpr,var1$k1,var2$k2
LimitExpr,Var,Val,Dir1, 0
CurlExpr1, Expr2, …, ExprN, Var1, Var2, …, VarN
SeriesExpr,Equalvar=limitpoint,Orde r,Dir1,0,-1
SumExpr,Var,Real1, Real2,Step
DivergenceExpr1, Expr2, …, ExprN, Var1, Var2, …, VarN
HessianExpr,LstVar
GradExpr,LstVar
Hessian Returns the Hessian matrix of an expression
IbpufVar, uVar, Var, Real1, Real2
TaylorExpr,Var=Value,Order
PrevalExprFvar,Reala,Realb,Var
SumriemannExprXpr,Lstvar1,var2
DivpcPoly1,Poly2,Integer
Solve
CsolveEq,Var CsolveEq1, Eq2,…, Var
ZerosExpr,Var or zerosExpr1, Expr2,…,Var1, Var2,…
Zerosx2-4 returns -2
CZerosExpr,Var CZerosExpr1, Expr2,…,Var1, Var2,…
Rewrite
Pow2expExpr
TexpandExpr
Exp2powExpr
Exp2trigExpr
Acos2asinExpr
Asin2atanExpr
Sin2costanExpr
Acos2atanExpr
Atan2acosExpr
Atan2asinExpr
Atan2asinatan2*x returns
Tan2sincosExpr
Atrig2lnExpr
TrigcosExpr
TrigtanExpr
TlinExprTrig
Integer
NextprimeInteger
GcdIntgr1, Intgr2,…
IsPrimeInteger
PrevprimeInteger
IremIntgr1, Intgr2
Polynomial
IquoIntgr1, Intgr2
Powmoda, n, p,Expr,Var
FactorsPoly or factorsPoly1, Poly2,…
CoeffPoly, Var, Integer
DivisPoly or divisPoly1, Poly2,…
GcdPoly1,Poly2
Symb2polyExpr,Var Symb2polyExpr, Var1, Var2,…
Poly2symbVector, Var
PcoefVect
PminMtrx,Var
QuoList1, List2, Var QuoPoly1, Poly2, Var
RemList1, List2, Var RemPoly1, Poly2, Var
FactorxnPoly
ContentPoly,Var
DegreePoly
SturmabPoly,Var,a,b
GreducePoly1, Poly2 Poly3 …, Var1 Var2…
CyclotomicInteger
GbasisPoly1 Poly2…, Var1 Var2…
HermiteInteger
Tchebyshev1Integer
LagrangeX1 X2…, Y1 Y2…
LaguerreInteger
Tchebyshev2Integer
Plot
App menu
PlotodeExpr, Var1, Var2, X0, Y0
PlotlistX1, Y1, X2, Y2, …
Function app functions
SOLVEEn,var,guess
Solve app functions
Spreadsheet app functions
SOLVEX2-X-2,X,3returns2
=STAT1A25A37,h n
FunctionNameinput,optional Parameters
=STAT1A25A37
As in SUMB7C23
Specify a block of cells, as in AVERAGB7C23
Calculates the arithmetic mean of a range of numbers
For example, AVERAGEB7B23 returns the arithmetic
Finance app
Set to
Second column is treated as the weight of the first
Columns are multiplied to generate a data point
Place column headers Place row headers Serr
REGRSInput range,model, configuration
STAT1A25A37
STAT1A25A37,h n x σ
Example REGRSA25B37,2
PredYmode, x, parameters
PredY
PredX
PredXmode, y, parameters
HypZ1mean x, n,μ0,σ,α,mode, configuration
HypZ1mean The one-sample Z-test for a mean
HypZ1mean0.461368, 50, 0.5, 0.2887, 0.05
HypZ1prop
HypZ2mean0.461368, 0.522851, 50, 50, 0.2887, 0.2887, 0.05
HypZ1propx,n,π0,α,mode
HypZ2prop
HypZ1prop21, 50, 0.5, 0.05,1
HypT1mean The one-sample t-test for a mean
Mode Specifies which alternative hypothesis to use ≠ μ0
HypT1mean x ,s,n,μ0, α,mode,configuration
HypZ2prop21, 26, 50, 50, 0.05
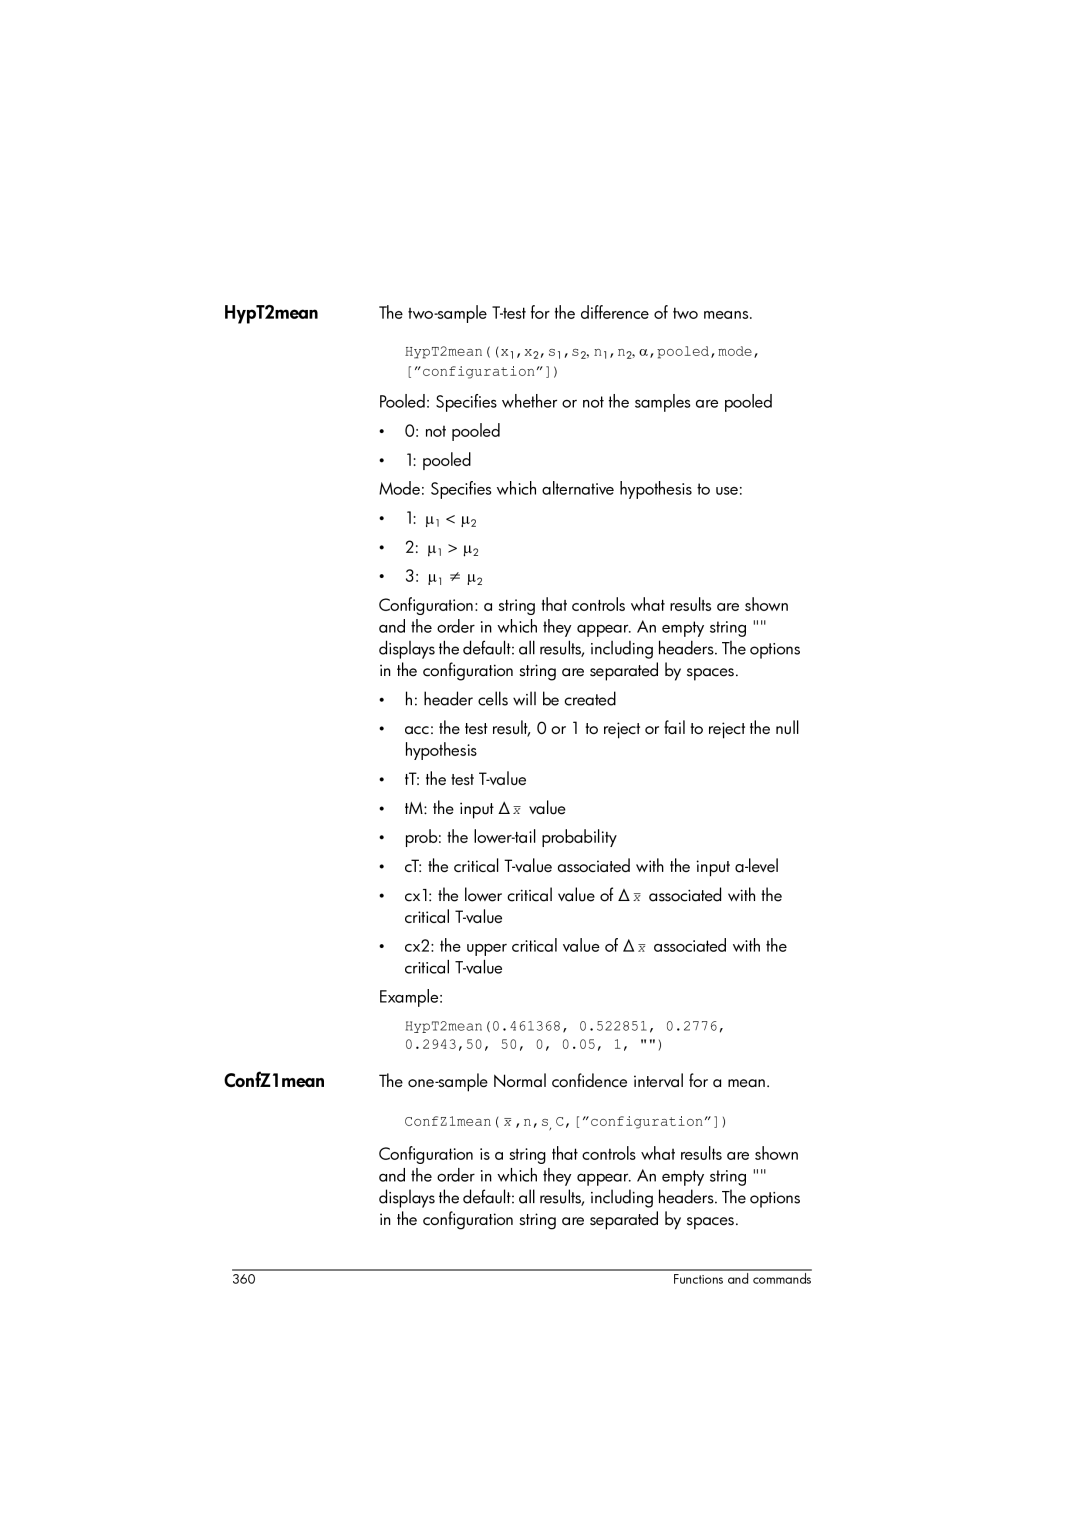
HypT2meanx1,x2,s1,s2, n1,n2, α,pooled,mode, configuration
ConfZ1mean x ,n,s, C,configuration
ConfZ1mean0.461368, 50, 0.2887
ConfZ2mean x1, x2, n1, n2,s1,s2,C, configuration
ConfZ1propx,n,C,configuration
ConfZ2mean0.461368, 0.522851, 50, 50, 0.2887, 0.2887
ConfZ2prop
ConfT1mean
ConfZ1prop21, 50
ConfT1mean0.461368, 0.2776, 50
ConfT2mean x1, x2, s1,s2,n1, n2,C,pooled, configuration
Statistics 1Var app functions
ConfT2mean0.461368, 0.522851, 0.2776, 0.2943, 50, 50, 0
Do1VStats
SetFreq
SetSample
Do2VStats
Statistics 2Var app functions
Resid
SetDepend
DoInference
Inference app functions
SetIndep
HypZ1mean
Test π value
Critical value of π associated with the critical Z-value
HypZ2mean x1, x2, n1, n2,σ1,σ2,α,mode
Test Δπ value
HypT1mean
Order
Critical value of the statistic associated with
HypT2meanx1,x2,s1,s2, n1,n2, α,pooled,mode
ConfZ1mean
ConfZ2mean
ConfZ1prop
Two proportions. Returns a list containing in order
Solves for the future value of an investment or loan
Finance app functions
CalcFV
CalcFVNbPmt,IPYR,PV,PMTV,PPYR,CPYR,BEG
CalcPMT
CalcIPYR
CalcNbPmt
CalcPV
Solve2x2
Linear Solver app functions
Triangle Solver app functions
Solve3x3
SASside,angle,side
AASangle,angle,side
ASAangle,side,angle
SSAside,side,angle
Linear Explorer functions
DoSolve
SolveForYIntercept
SOLVEa, b, c
Quadratic Explorer functions
Common app functions
DELTAa, b, c
UNCHECKDigit
Ctlg menu
Function.CHECK1
Enter Sequence.UNCHECK2
Percent of y. Returns x/100*y Example
Change Percent change from x to y. Returns 100*y-x/x
Var=expression
List1.*List2 or Matrix1.*Matrix2
List.Integer or Matrix.Integer
3,4.*3,4,5,6 gives 3,8,15,24
AbcuvPolyA, PolyB, PolyC, Var
A2qMatrix, Var1, Var2…
A2q1,2,4,4,x,y returns x2+6*x*y+4*y2
Abcuvx2+2*x+1,x2-1,x+1 returns 1/2 -1/2
Append Appends an element to a list or vector
Canonicalform2*x2-12*x+1 gives 2*x-32-17
BasisMatrix
CanonicalformQuadraticExpr,Var
CatObject1, Object2,…
ColDim Returns the number of columns of a matrix
Companion Returns the companion matrix of a polynomial
Complexrootx3+8, 0.01 returns
CopyVarVar1,Var2
ContainsList, Element or containsVector, Element
Contains0,1,2,3,2 returns
CorrelationList or correlationMatrix
Returns
Enters the mathematical constant e Euler’s number
Eigenvals Returns the sequence of eigenvalues of a matrix
Eval Evaluates an expression
Evalf2/3 gives
EvalcExpr
EvalfExpr,Integer
Even1251 returns
Expr Parses the string String into a number or expression
ExprX+10 returns 100, if the variable X has the value
FMinExpr,Var
FMaxExpr,Var
FMax-x2+2*x+1,x gives
FMinx2-2*x+1,x gives
Functiondiffsin gives x→cosx
FsolveExpr,Var,Guess or Interval,Method
FunctiondiffFnc
GaussExpr,VectVar
Halftanhyp2expsinx+sinhx returns
GramschmidtVector, Function
Halftanhyp2expExprTrig
HamdistInteger1, Integer2
Head1,2,3 gives
IcontentPoly,Var
Icontent24x3+6x2-12x+18 gives
HeavisideReal
Interval2center Returns the center of an interval
Inv Returns the inverse of an expression or matrix
IPartReal or iPartList
JacobisymbolInteger1, Integer2
Jacobisymbol132,5 gives
IPart4.3 returns
Lin Returns an expression with the exponentials linearized
Lname Returns a list of the variables in an expression
Logb Returns the logarithm of base b of a
Lvar Returns a list of variables used in an expression
Mat2list Returns a list containing the elements of a matrix
MedianList1, List2 or medianMatrix
MeanList1, List2 or meanMatrix
Mean1,2,3,1,2,3 gives 7/3
Median1,2,3,5,10,4 gives
MRowExpr, Matrix, Integer
ModgcdPoly1,Poly2
Modgcdx4-1,x-12 gives
MultcconjugateExpr
Normal2*x*2 gives 4*x
NDerivfx,x,h returns fx+h-fx-h*0.5/h
NormalExpr
NormalizeVector or normalizeComplex
PI Inserts π
PIECEWISE⎪
PlotpolarExpr,Var=Interval
PlotparamfVar+i*gVar, Var= Interval
Plotparamcost+i*sint, t=0..2*π plots the unit circle
Plotpolarπ/2x, x=-π..π plots a partial spiral
POLYCOEFVector or POLYCOEFList
PoleCrcle,Line
Polecircle0, 1, line1+i, 2 returns point1/2,1/2
POLYCOEF-1, 1 returns 1, 0
Polynomialregression1, 2, 3, 4, 1, 4, 9, 16,3 returns 0 1 0
PolygonscatterplotMatrix
PolynomialregressionList1, List2, Integer
POLYROOTPoly or POLYROOTVector
Powerpccircle0,1+i,3+i gives
PowerregressionList1, List2
Powerregression1, 2, 3, 4, 1, 4, 9, 16 returns 2
Prepend1,2,3 gives 3,1,2
Purge Unassigns a variable name
Quote Returns an expression unevaluated
⎠ returns
RemoveElement, Vector or removeElement, List
Reducedconicx2+2*x-2*y+1 returns
RefMatrix
Remove6,1 2 6 7 returns 1 2
Residue Returns the residue of an expression at a value
Restart Purges all the variables
RowDim Returns the number of rows of a matrix
Example Gives
Signature Returns the signature of a permutation
Sqrt Returns the square root of an expression
Sto Stores a real or string in a variable
Sylvester Returns the Sylvester matrix of two polynomials
Transpose Returns a matrix transposed without conjugation
Type Returns the type of an expression e.g. list, string
When Used to introduce a conditional statement
Returns the square of an expression
Creating your own functions
Inserts the imaginary number
Expr
Function field, enter the function. eAA+fABAC
Variables
Working with Home variables
AaE
Result is written to history Multiply a by
Working with user variables Working with app variables
AAxotwAS. Sq1o2 o3 E
Example 3 You can also store objects in variables
More about the Vars menu
Qualifying variables
Home variables are accessed by pressing aand Tapping
Home variables
NumStart NumType NumStep NumZoom NumIndep
App variables
Function app variables
AAngle ADigits AComplex AFormat
Geometry app variables
Results variables
Solve app variables
Category Names Symbolic Plot
Spreadsheet app variables
ColWidth RowHeight
Advanced Graphing app variables
NumXStart
NumYStart NumType NumXStep NumXZoom NumYStep NumYZoom
Statistics 1Var app variables
MedVal
NbItem
MinVal
MaxVal
Statistics 2Var app variables
SCov
Corr
CoefDet
ΣCov
Inference app variables
SerrY
Contains the sum of the dependent values Y
CritVal2
CritScore
CritVal1
Prob
Parametric app variables
NumStart NumType NumStep NumZoom
Θmin Recenter
Polar app variables
Finance app variables
NumIndep NumType NumStart NumZoom NumStep
Linear Explorer app variables
Linear Solver app variables
Triangle Solver app variables
Quadratic Explorer app variables
Trig Explorer app variables
Sequence app variables
Category Names Modes
Unit categories
Units and constants
Units
Length Acceleration
Units menu includes an entry that is not a unit
Unit calculations
Prefixes
Palette of prefixes
+5 SF
Unit tools
MKSA8.175cm/s returns .08175m*s-1
Physical constants
UFACTOR100C,1A returns 100A*s
USIMPLIFY5kg*m2/s2 returns 5J
Value or measurement?
List of constants
Avogadro, NA
450
Lists
Create a list in the List Catalog
= or \
Keys
List Editor
List Editor Buttons
=or \
To edit a list
To insert an element
A list
To delete a list
Deleting lists
Lists in Home view
To createa list
To display a list
To store a list
Aj7
To display one
Data on page 44 for instructions
List functions
To send a list
2,3 returns 5,10,15
Menu format
Make List
Sort
Aajo
Reverse Concatenate Position Size
Aj5E
Aj5 E
Aj1
Finding statistical values for lists
Aj1E
Ad1E
Beginning on page 211, for the meaning of each statistic
Matrices
Vectors
Matrices
Creating and storing matrices
POLYROOT1,0,-1,0M1
Working with matrices
Editor
Matrix Editor
To create a matrix in the Matrix Editor
Matrices in Home
View
To store a matrix
To display a matrix
To send a matrix
Matrix arithmetic
R1o2
Matrixnamerow,column
To multiply
E3 E
HAQ1 +
Divide by a scalar
AQ1sA
AQ1k5
AQ1kQ
Solving systems of linear equations
Q1 n AQ2
1E1E Q1E
2E3E Tap in cell R1, C3 E
4EQ1
Matrix functions and commands
Commands
Sns AQ1E
TRN matrix
Matrix functions
Argument conventions
TRN ⎜
3,2,3,4
Rref matrix
Rref
IDENMATsize
Hilbertn
JordanBlockExpr,n
0 JordanBlock7,3 returns 0 7 1 0 0
Cos1 -sin1sin1 cos1
Rownorm ⎜
Cond
Specnorm ⎜
Specrad ⎜
Rank
Eigenvv matrix
EIGENVALmatrix
37228… -0.37228…
Eigenvv
Cholesky ⎜
Choleskymatrix
Example CAS view
IhermiteMtrxA
IsmithMtrxA
HessenbergMtrxA
278
Ismith ⎜
P*A=L*U
LSQmatrix1, matrix2
LSQ
LUmatrix
Example Schur ⎛⎜ 1 2 ⎞⎟ returns
QRmatrix A,var1,var2
SCHURmatrix
SVD ⎝
DOT 1 2 , 3 4 returns
4649… 0.3659…
Cross 1 2 , 3 4 returns
L2normVect
Examples
MaxnormVect or Mtrx
Maxnorm 1 2 3 -4 returns
+ y z = 5 2x y = 2y + z =
488
Editing
Features. See below
Opens the selected note for
Begins a new note,
To create a note from the Notes Catalog
Rename renames the selected note
Open the Note Catalog
To create a note for an app
Keys
Are adding or editing a note
Make the next character upper-case
With lowercase locked, make next character uppercase
Text formatting
Inserting
Mathematical
Expressions
Sharing notes
Pixon xposition, yposition
HP Prime Programs Command Structure
Programming in HP PPL
Pixon xposition, yposition ,color
Export Myprogam Begin
Program Catalog
Program Structure Comments
END
Open Program Catalog
Program Catalog buttons and keys
=or S\
Creating a new program
Myprogram
Or S=and Checks the current program for errors
Program Editor
Strings Drawing Matrix App Functions Integer More
Press Jto return to the main menu
Begin and END
For N from 1 to 3 do
Run a Program
Tap Myprogram to expand the menu and select Myprogram
Programs
Debug a Program
Multi-function
Parameters
Program Catalog, select
Edit a program Copy a program or part of a program
510
HP Prime programming language
To share a program
Variables and visibility
Export Radius Export Getradius Begin Inputradius END
Programming in HP PPL 513
Export Rolldien
Program Rolldie
Program
Return 1+RANDINTN-1
ROLLDIEn
L2roll+1 L2roll
Rolldie
Return 1+RANDINTn-1 END
User mode
User Keyboard Customizing key presses
Begin Return 1+RANDINTN-1 END
Re-assigning keys
Key names
Internal name of keys and key states
KDiv
App programs
KAMath
Starts an app
Using dedicated program functions Redefining the View menu
Resets or Initializes an app
View text, function
Customizing an app
Tap Enter a name for the new app such as
DiceSimulation
Begin END
Dicesimvars Rolldie
Export SIDES,ROLLS Export DiceSimulation
View Roll Dice,ROLLMANY
SIDES= Floorsides If SIDES2 then
Sides
Begin Repeat
Until Sides =4 STARTVIEW7,1 END
Export ROLLS,SIDES Export Dicesimvars Begin
STARTVIEW1,1 END
STARTVIEW0,1 END
Sides END
Program commands
Roll Dice
Branch
Commands under the Tmplt menu Block
Begin END Syntax Begin command1 command2… commandN END
Export SQM1X Begin Return END
Default commands END
Loop
Case
MAXFACTORS100
Export Maxfactorsn Begin
MSGBOXMax of + max + factors for +result
Export Drawpattern Begin
Rect
END Wait
Export ISPERFECTn
Export Sides Export Getsides Begin Repeat
+1 d END Return sum==n END
Export Perfectnums Begin
INPUTSIDES,Die Sides,N = ,Enter num sides,2
Export Syntax Export var1, var2, …, varn
Variable
Function
Syntax Export FunctionName
Commands under the Cmds menu Strings
Char Syntax CHARvector or CHARinteger
String
StringF1, when F1X Cosx = Cosx
666666666667
INSTRINGvanilla,van returns Instring banana,na returns
Drawing
Ymax
Pixels and Cartesian
Grobh Syntax Grobhg
Getpix Syntax GETPIXG, x, y
GETPIXPG, x, y
Grobhpg
Grobwpg
INVERTPG, x1, y1, x2, y2
PIXOFFPG, x, y
Pixon Syntax PIXONG, x, y ,color
PIXONPG, x, y ,color
Export BOX Begin Rect RECTP40,90,#0
Wait END
Textoutppi APPROX=,0,30 Repeat
Export Piseries Begin
Local sign K=2 A=4 sign=−1 Rect TEXTOUTPN=,0,0
+sign*4/2*K-1 a
Addcol Syntax ADDCOLmatrixname, vector, columnnumber
Sign*-1 sign K+1 K
Until END
Addrow Syntax ADDROWmatrixname, vector, rownumber
Scaleadd Syntax Scaleadd name, value, row1, row2
Replace Syntax REPLACEname, start, object
Scale Syntax SCALEname, value, rownumber
SUB Syntax SUB name, start, end
App Functions
Commands
Bitand Syntax BITANDint1, int2, … intn
Bitsl Syntax BITSLint1 ,int2
→R Syntax B→R#integerm
Getbase Syntax GETBASE#integerm
Setbits Syntax SETBITS#integerm ,bits
Getbits Syntax GETBITS#integer
Example GETBITS#22122 returns #20h or →B Syntax R→Binteger
Choose Syntax CHOOSEvar, title, item1, item2,…,itemn
Editmat Syntax EDITMATmatrixvar
Taps Example EDITMATM1 edits matrix M1 Getkey Syntax Getkey
Input Syntax INPUTvar ,title, label, help, reset
Export Sides Export Getsides
Begin INPUTSIDES,D ie Sides,N = ,Enter num sides,2 END
Msgbox Syntax MSGBOXexpression or string ,okcancel?
Export Areacalc Begin
Programming in HP PPL 553
CAS Syntax CAS.function or CAS.variable
Executes the function or returns the variable using
More
Execon Syntax EXECON&expr, List1, list2,…
Example →HMS54.8763 returns 5452′34.68″
Example ITERATEX2, X, 2, 3 returns
EXECON&23+&1,1,5,16,4,5,6,7 returns 7,12
Variables and Programs
Programming in HP PPL 557
Axes
App variables
Plot view variables
Cursor
Hwidth
GridLines
Hmin/Hmax
Labels
SeqPlot
Nmin/Nmax
Recenter S1mark-S5mark
Θmin/θmax
Θstep Polar Tmin/Tmax
Tstep
Xtick Ytick Xmin/Xmax
Xzoom
Symbolic view variables
Ymin/Ymax
Yzoom
F0...F9
H1...H5
H1Type...H5Type
R0...R9
S1...S5
S1Type...S5Type
Type
X0, Y0...X9,Y9
U0...U9
D0...D9
Numeric view variables
C0...C9
NumIndep
NumYStep where n
NumStep where n
NumXStep where n
NumType-forAutomatic default NumType-forBuildYourOwn
Inference app variables
NumXZoom where n
NumYZoom where n
Alpha Conf
Mean1
Mean1
Mean2
Mean2
Pooled-for pooled
Pooled-for not pooled default
Pooled
Difference of two means or two proportions, sets
Finance app
Variables
CPYR
NbPmt
NbPmt
IPYR
PMTV
Linear Solver app variables
Triangle
Solver app
AngleB
SideC
AngleA
AngleC
Settings
Home
Time
HComplex
Date
Language
Bits
Entry
Base
Signed
AAngle
Symbolic
Setup
AComplex
AFormat
AFormat
580
Basic integer arithmetic
Default base
Changing the default base
Binary, Octal, Decimal or Hex
Examples of integer arithmetic
Mixed-base arithmetic
Integer manipulation
Base functions
These are described in Integer, beginning on
Glossary
Catalog
Vector One-dimensional array of real or
Matrix Two-dimensional array of real or
Record using the Program Editor
Symbolic, and Symbolic Setup
590
Calculator not responding
Troubleshooting
To reset
If the calculator does not turn on
Operating limits
Status messages
Proper syntax
Correct. Look up the function
Name in the index to find its
Apps, matrices, lists, notes, or
594
Modifications
Product regulatory information
Federal Communications Commission notice
Cables
596
European Union Regulatory Notice
598
Chemical
Substances
Parliament and the Council. a chemical information
600
Index
Menu 324-347 settings 30, 55 view
CAS 54
370-371
Functions 118-122, 348 variables
366-369
299-301
606
Zoom 88-94 points Polar app 70, 277-280 variables
Samples 514-516, 524-527 structure
Solve app 70, 259-266 functions 349 limitations 264 messages
215
App 109, 558-579 CAS
Types of 89-90