Featured Functions |
STEP 2
Be sure to activate your settings before exiting.
•When using the Web Browser interface, activate by clicking on the Activate button.
•When using the Console utility, activate by first highlighting the Activate menu option, and then press Enter. You should receive the Mirror port settings are now active! (Press any key to continue) message.
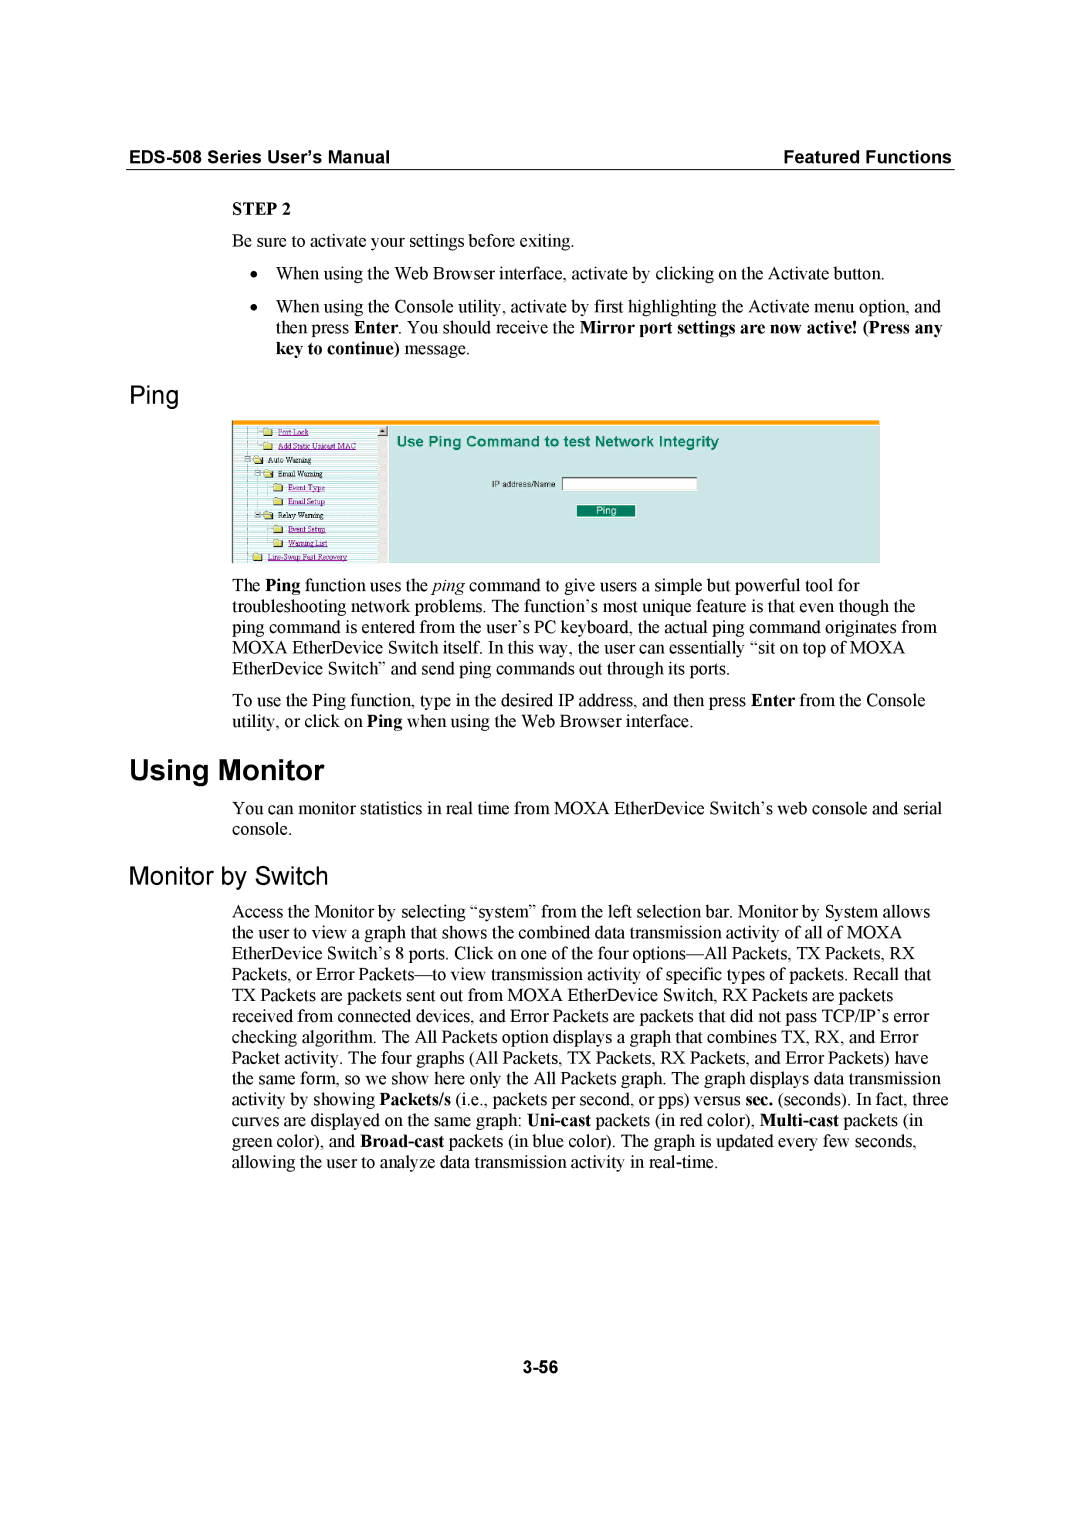
Ping
The Ping function uses the ping command to give users a simple but powerful tool for troubleshooting network problems. The function’s most unique feature is that even though the ping command is entered from the user’s PC keyboard, the actual ping command originates from MOXA EtherDevice Switch itself. In this way, the user can essentially “sit on top of MOXA EtherDevice Switch” and send ping commands out through its ports.
To use the Ping function, type in the desired IP address, and then press Enter from the Console utility, or click on Ping when using the Web Browser interface.
Using Monitor
You can monitor statistics in real time from MOXA EtherDevice Switch’s web console and serial console.
Monitor by Switch
Access the Monitor by selecting “system” from the left selection bar. Monitor by System allows the user to view a graph that shows the combined data transmission activity of all of MOXA EtherDevice Switch’s 8 ports. Click on one of the four