58Chapter 3 Device Manager basics
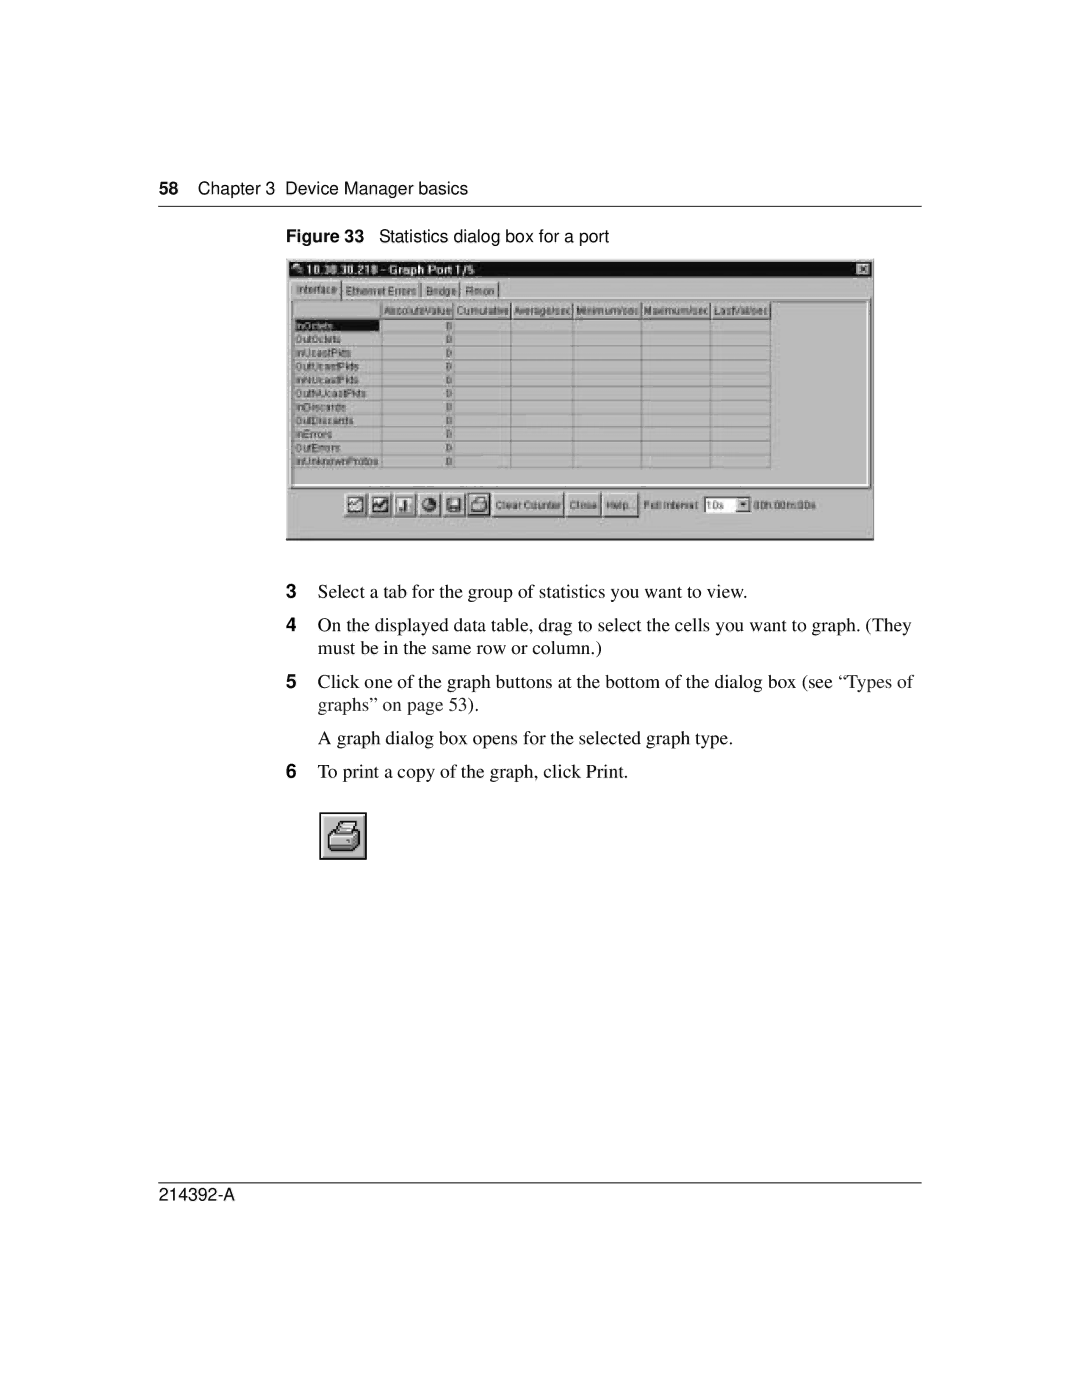
Figure 33 Statistics dialog box for a port
3Select a tab for the group of statistics you want to view.
4On the displayed data table, drag to select the cells you want to graph. (They must be in the same row or column.)
5Click one of the graph buttons at the bottom of the dialog box (see “Types of graphs” on page 53).
A graph dialog box opens for the selected graph type.
6To print a copy of the graph, click Print.