Chapter 4 | MonComm Software |
To Adjust the Graph’s Scope:
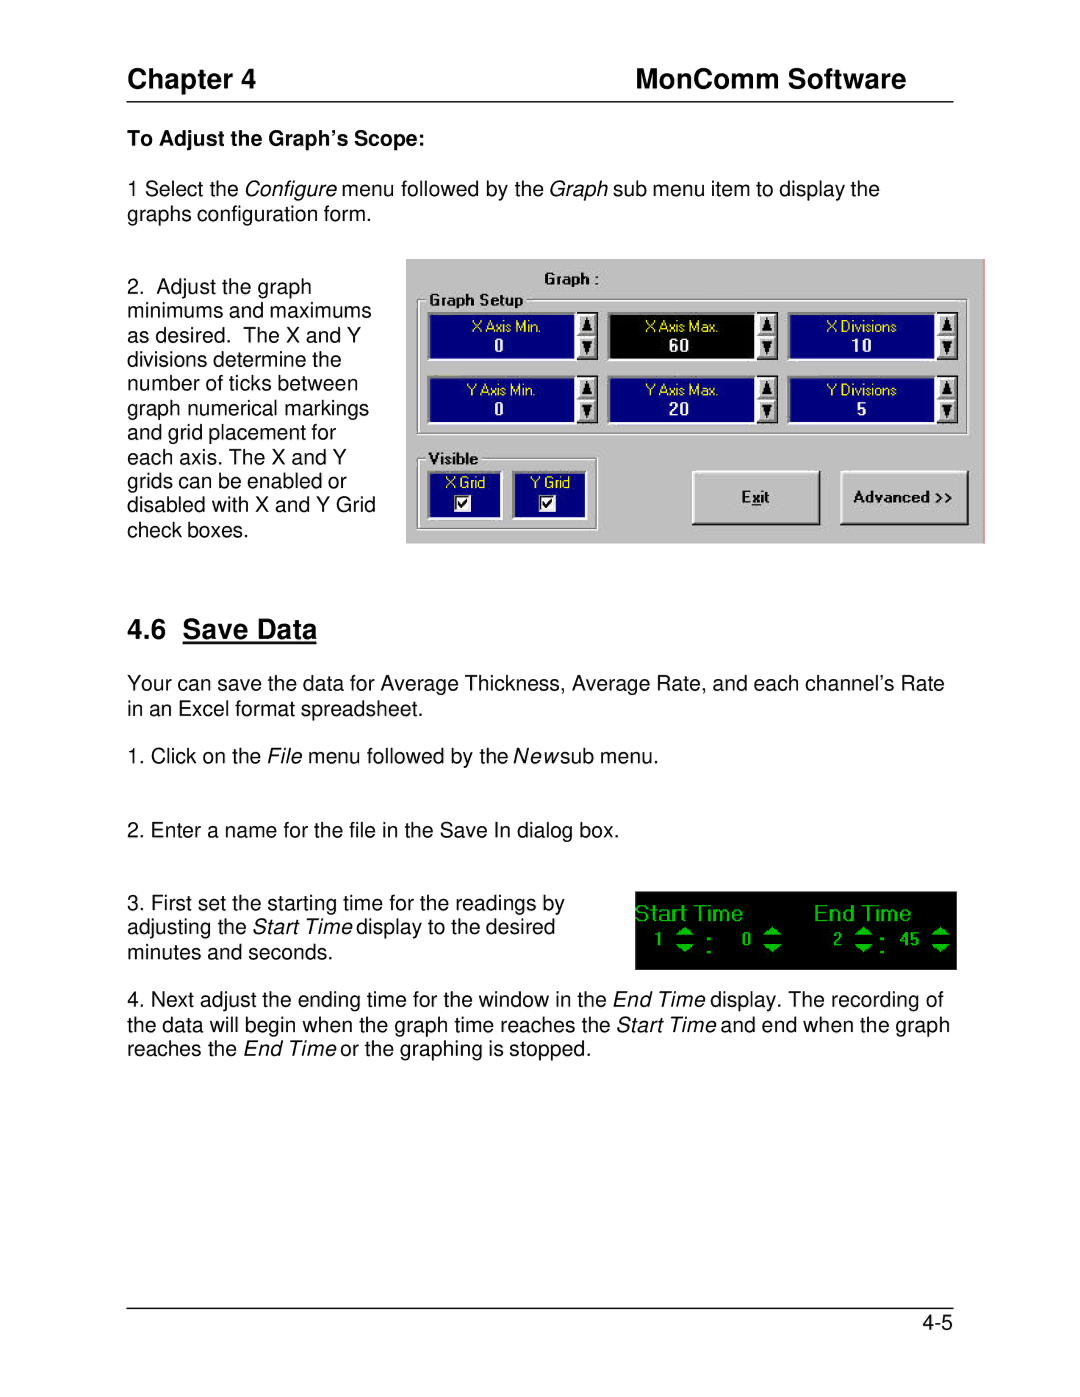
1 Select the Configure menu followed by the Graph sub menu item to display the graphs configuration form.
2.Adjust the graph minimums and maximums as desired. The X and Y divisions determine the number of ticks between graph numerical markings and grid placement for each axis. The X and Y grids can be enabled or disabled with X and Y Grid check boxes.
4.6Save Data
Your can save the data for Average Thickness, Average Rate, and each channel’s Rate in an Excel format spreadsheet.
1.Click on the File menu followed by the New sub menu.
2.Enter a name for the file in the Save In dialog box.
3.First set the starting time for the readings by
adjusting the Start Time display to the desired minutes and seconds.
4.Next adjust the ending time for the window in the End Time display. The recording of the data will begin when the graph time reaches the Start Time and end when the graph reaches the End Time or the graphing is stopped.