Chapter 4 | MonComm Software |
4.5Graph Data
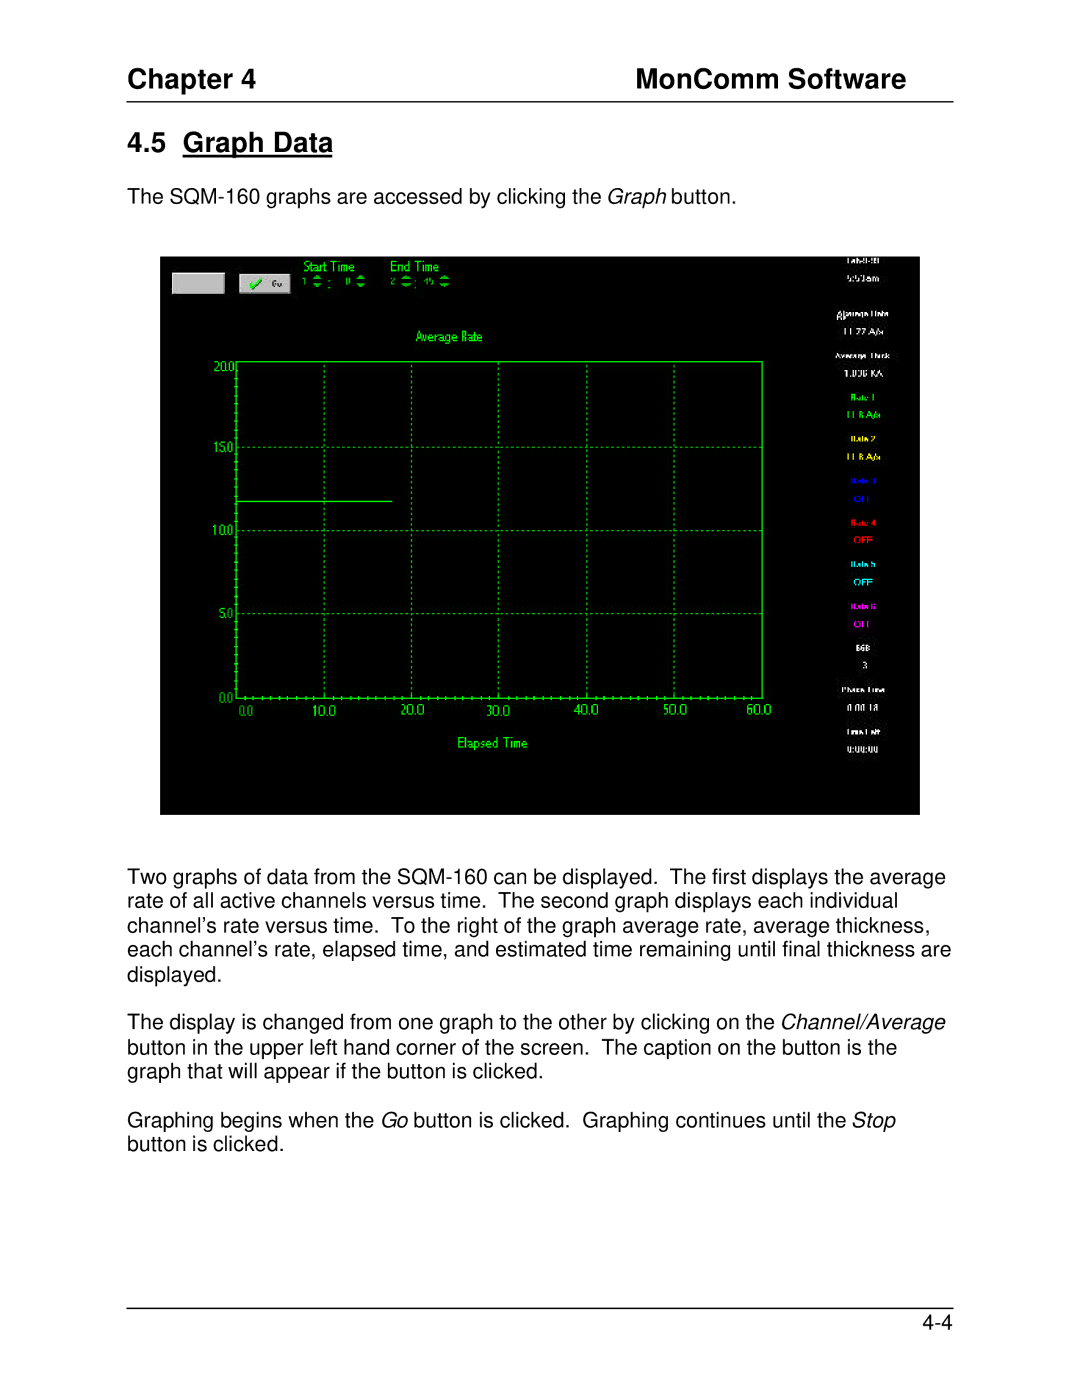
The
Two graphs of data from the
The display is changed from one graph to the other by clicking on the Channel/Average button in the upper left hand corner of the screen. The caption on the button is the graph that will appear if the button is clicked.
Graphing begins when the Go button is clicked. Graphing continues until the Stop button is clicked.