FEEDBACK DISPLAY
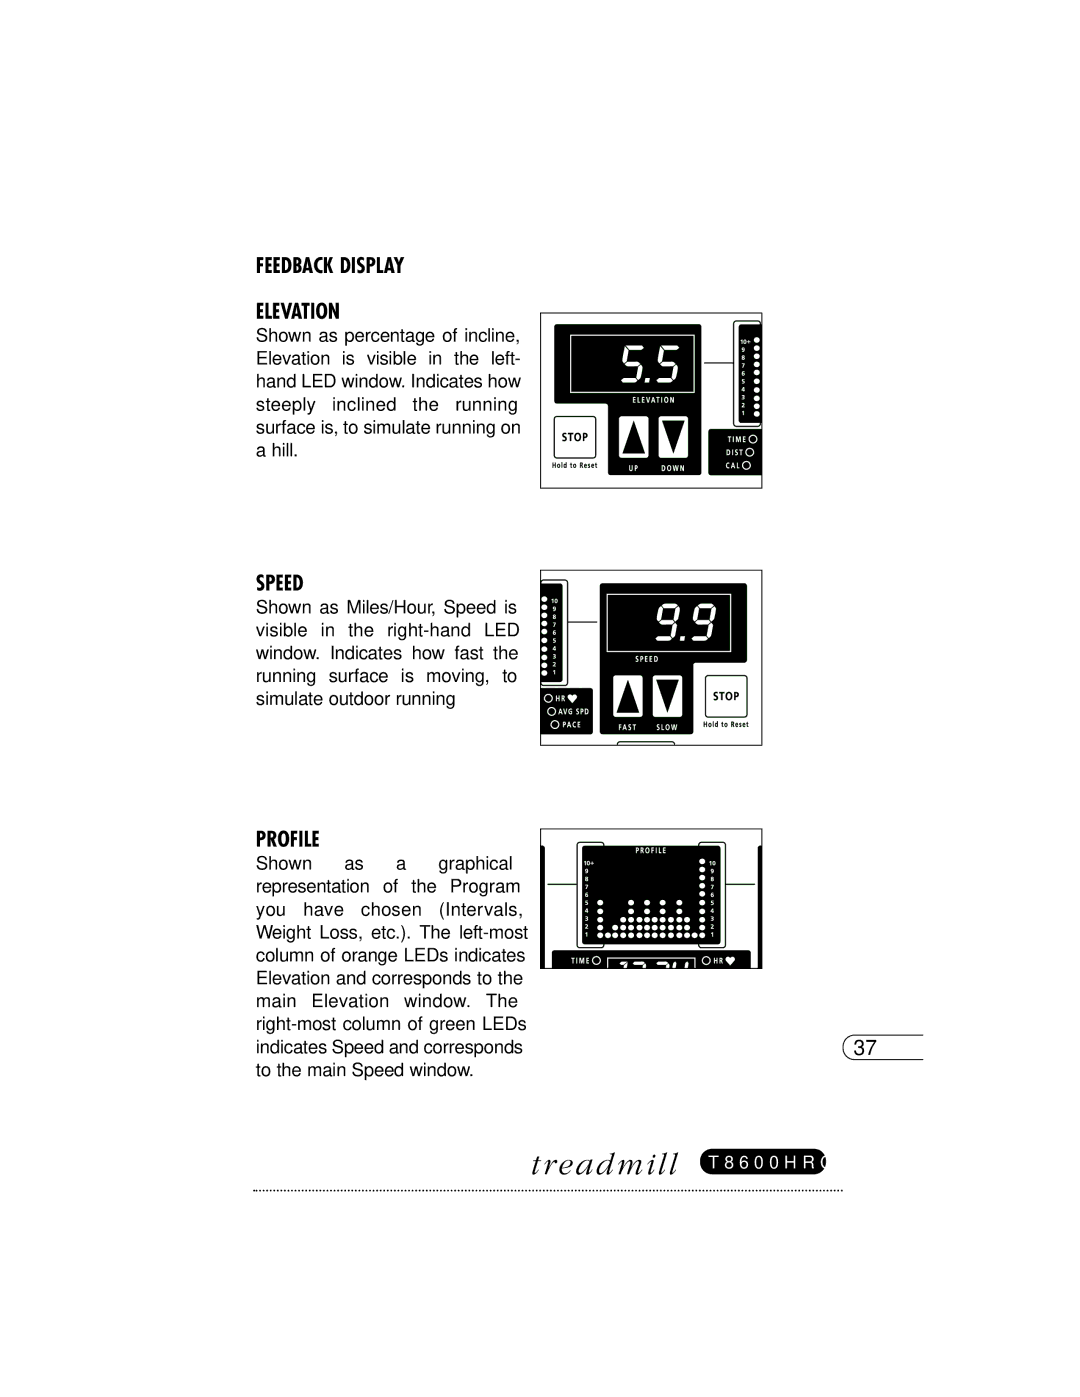
ELEVATION
Shown as percentage of incline, Elevation is visible in the left- hand LED window. Indicates how steeply inclined the running surface is, to simulate running on a hill.
SPEED
Shown as Miles/Hour, Speed is visible in the
PROFILE |
|
|
|
|
|
|
|
|
| |
Shown | as | a | graphical |
|
|
|
|
|
| |
representation of | the | Program |
|
|
|
|
|
| ||
|
|
|
|
| ||||||
you | have | chosen | (Intervals, |
|
|
|
|
|
| |
Weight Loss, etc.). The |
|
|
|
|
|
| ||||
column of orange LEDs indicates |
|
|
|
|
|
| ||||
Elevation and corresponds to the |
|
|
|
|
|
| ||||
|
|
|
|
|
| |||||
main | Elevation | window. The |
|
|
|
|
| |||
37 | ||||||||||
indicates Speed and corresponds | ||||||||||
to the main Speed window. |
|
|
|
|
| |||||
tr eadmill T 8 6 0 0 H R C
