Universal Switching Module Enhanced
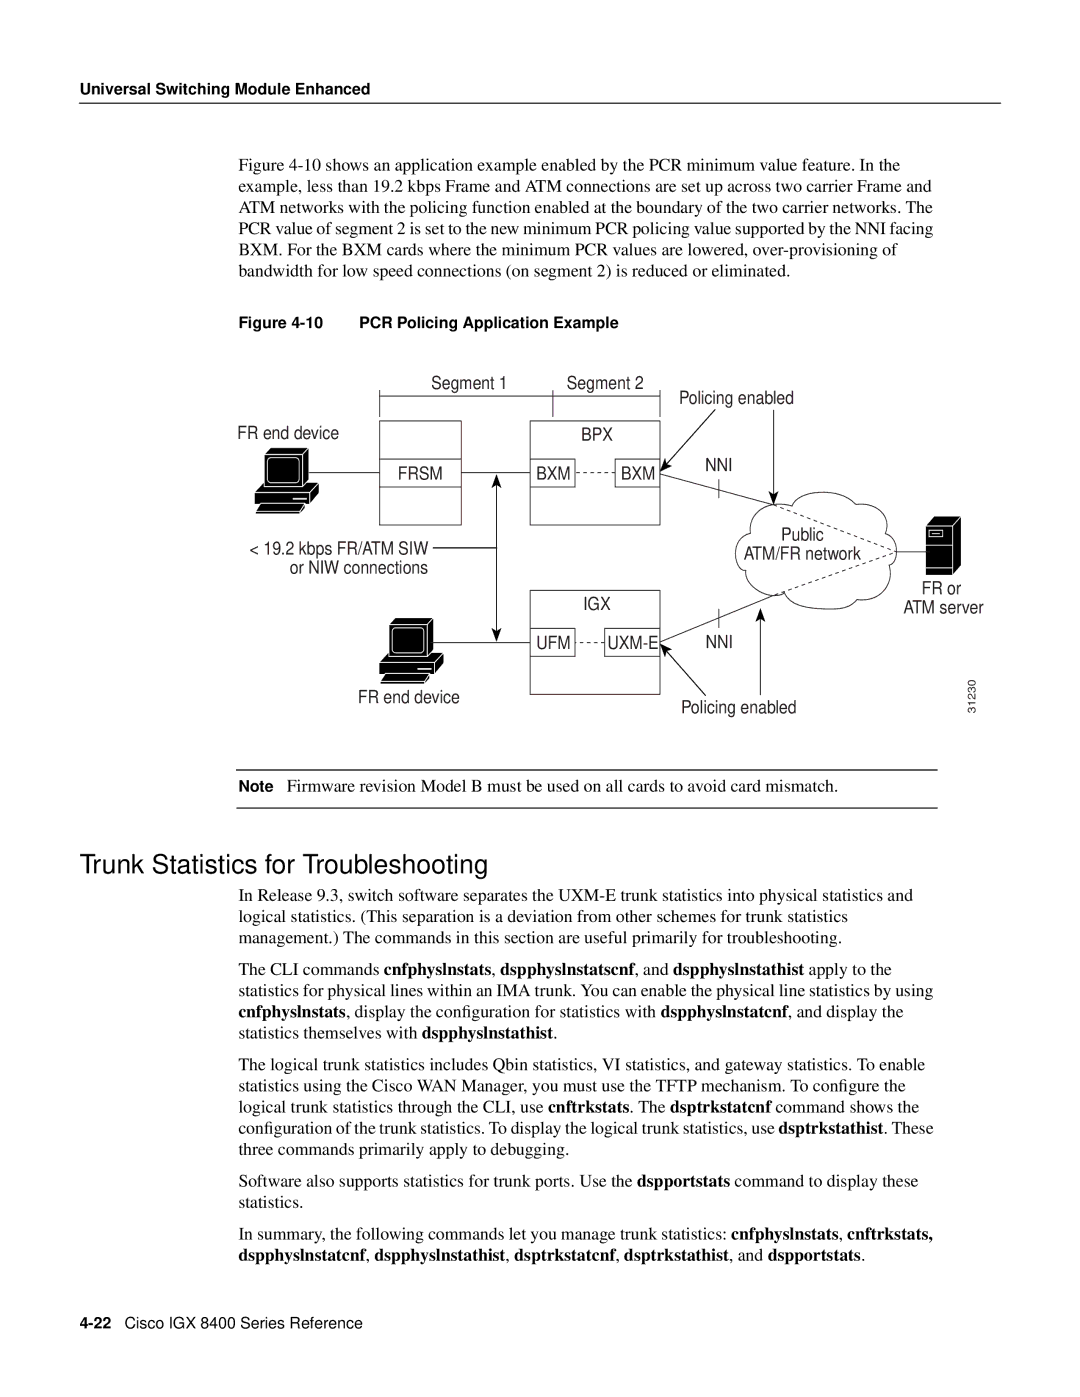
Figure 4-10 shows an application example enabled by the PCR minimum value feature. In the example, less than 19.2 kbps Frame and ATM connections are set up across two carrier Frame and ATM networks with the policing function enabled at the boundary of the two carrier networks. The PCR value of segment 2 is set to the new minimum PCR policing value supported by the NNI facing BXM. For the BXM cards where the minimum PCR values are lowered, over-provisioning of bandwidth for low speed connections (on segment 2) is reduced or eliminated.
Figure 4-10 PCR Policing Application Example
|
|
|
| Segment 1 |
| Segment 2 | |||
FR end device |
|
|
|
|
|
| |||
|
|
|
|
|
| ||||
|
|
|
|
|
| ||||
|
|
|
| BPX | |||||
|
|
|
|
|
|
|
|
|
|
|
|
|
| FRSM |
| BXM |
| BXM | |
|
|
|
|
|
| ||||
|
|
|
|
|
|
|
|
|
|
|
|
|
|
|
|
|
|
|
|
|
|
|
|
|
|
|
|
|
|
Policing enabled
NNI
Public
<19.2 kbps FR/ATM SIW or NIW connections
FR end device
IGX
UFM |
| |
|
|
|
ATM/FR network
NNI
Policing enabled
FR or ATM server
31230
Note Firmware revision Model B must be used on all cards to avoid card mismatch.
Trunk Statistics for Troubleshooting
In Release 9.3, switch software separates the
The CLI commands cnfphyslnstats, dspphyslnstatscnf, and dspphyslnstathist apply to the statistics for physical lines within an IMA trunk. You can enable the physical line statistics by using cnfphyslnstats, display the configuration for statistics with dspphyslnstatcnf, and display the statistics themselves with dspphyslnstathist.
The logical trunk statistics includes Qbin statistics, VI statistics, and gateway statistics. To enable statistics using the Cisco WAN Manager, you must use the TFTP mechanism. To configure the logical trunk statistics through the CLI, use cnftrkstats. The dsptrkstatcnf command shows the configuration of the trunk statistics. To display the logical trunk statistics, use dsptrkstathist. These three commands primarily apply to debugging.
Software also supports statistics for trunk ports. Use the dspportstats command to display these statistics.
In summary, the following commands let you manage trunk statistics: cnfphyslnstats, cnftrkstats, dspphyslnstatcnf, dspphyslnstathist, dsptrkstatcnf, dsptrkstathist, and dspportstats.
