Americas Headquarters
Text Part Number OL-29168-01
Page
N T E N T S
Iii
Advanced Setup for the Appliance
Interface Support
Understanding Inline Vlan Pair Mode
Configuring Alert Severity
Vii
Example String XL TCP Engine Match Offset Signature
Viii
Understanding Worms
Configuring Global Correlation
Configuring IP Logging
Routers
Xii
Using Rommon
Xiii
Configuring the ASA 5585-X IPS SSP
Xiv
Upgrading, Downgrading, and Installing System Images
NotificationApp
Xvi
AIC Engine B-10
Xvii
Creating the Service Account C-5
Xviii
Communication Problems
Xix
Understanding the show tech-support Command C-75
CLI Validation Error Messages D-6
Xxi
Xxii
Audience
Contents
Organization
Xxiv
Convention Indication
Conventions
Related Documentation
Xxv
Obtaining Documentation and Submitting a Service Request
Xxvi
Supported User Roles
Logging In Notes and Caveats
Ii-1
For More Information
Logging In to the Appliance
Ii-2
Ii-3
Connecting an Appliance to a Terminal Server
Config t
Exit Wr mem
Ii-4
Logging In to the ASA 5500-X IPS SSP
Asa# session ips
Ii-5
Logging In to the ASA 5585-X IPS SSP
Asa# session
Logging In to the Sensor
Ii-6
Ii-7
Ii-8
IPS CLI Configuration Guide
Supported IPS Platforms
Sensor Configuration Sequence
User Roles
Operators
Administrator
Service
Viewers
Prompts
CLI Behavior
Following tips help you use the Cisco IPS CLI
Help
Case Sensitivity
Command Line Editing
Recall
Display Options
Keys Description
Character Description
IPS Command Modes
Regular Expression Syntax
String
Matches any character
Only if it is at the end of the string
Matches a as well as b
Or more times
Generic CLI Commands
Sensor# configure terminal
CLI Keywords
OL-29168-01
Initializing the Sensor
Initializing Notes and Caveats
System Configuration Dialog
Simplified Setup Mode
Understanding Initialization
Example 2-1shows a sample System Configuration Dialog
Example 2-1 Example System Configuration Dialog
Basic Sensor Setup
Initializing the Sensor Basic Sensor Setup
Initializing the Sensor Basic Sensor Setup
Following configuration was entered
Advanced Setup
Initializing the Sensor Advanced Setup
Advanced Setup for the Appliance
Enter numbers for Vlan 1
Enter 1 to edit the interface configuration
Enter a subinterface number and description
Press Enter to return to the available interfaces menu
Enter 2 to modify the virtual sensor configuration, vs0
Enter 2 to edit the virtual sensor configuration
Press Enter to return to the top-level editing menu
Host-ip 192.168.1.2/24,192.168.1.1
Enter 2 to save the configuration
Advanced Setup for the ASA 5500-X IPS SSP
Reboot the appliance
Enter 2 to modify the virtual sensor vs0 configuration
Enter a name and description for your virtual sensor
Modify default threat prevention settings?no
Reboot the ASA 5500-X IPS SSP
Asa-ips#show tls fingerprint
Advanced Setup for the ASA 5585-X IPS SSP
Enter 2 to edit the virtual sensor configuration
Exit Service analysis-engine
Verifying Initialization
Reboot the ASA 5585-X IPS SSP
Ips-ssp#show tls fingerprint
View your configuration
Sensor# show configuration
Display the self-signed X.509 certificate needed by TLS
Sensor# show tls fingerprint
Setting Up the Sensor
Setup Notes and Caveats
Understanding Sensor Setup
Changing Network Settings
Changing the Hostname
Change the sensor IP address, netmask, and default gateway
Exit network settings mode
Enter network settings mode
Changing the IP Address, Netmask, and Gateway
Enable Telnet services
Enabling and Disabling Telnet
Changing the Access List
Verify that Telnet is enabled
Change the value back to the default
Verify the change you made to the access-list
Remove the entry from the access list
Verify the value has been set back to the default
Change the number of seconds of the FTP timeout
Changing the FTP Timeout
To change the FTP timeout, follow these steps
Verify the FTP timeout change
Add the banner login text
Adding a Login Banner
Verify the banner login text message
Verify the login text has been removed
Enable a DNS server
Verify the settings
Login-banner-text defaulted dns-primary-server
Verify that SSHv1 fallback is enabled
Enabling SSHv1 Fallback
Verify the CLI session timeout change
Changing the CLI Session Timeout
Change the number of seconds of the CLI session timeout
Exit authentication mode
When disabled, the client can use the following ciphers
Changing Web Server Settings
TLSDHERSAWITHAES256CBCSHA256 TLSDHEDSSWITHAES256CBCSHA256
Sensor# configure terminal Sensorconfig# service web-server
Change the port number
Verify the defaults have been replaced
Specify the web session inactivity timeout
Turn on logging for web session inactivity timeouts
Turn on TLS client ciphers restriction
Configuring Authentication and User Parameters
Adding and Removing Users
Specify the parameters for the user
Sensorconfig# username username password password privilege
Sensorconfig# username tester privilege administrator
Sensor# show users all
To remove a user, use the no form of the command
Configuring Authentication
Sensor# configure terminal Sensorconfig# no username jsmith
Radius Authentication Options
Configuring Local or Radius Authentication
Sensorconfig-aaa-rad#default-user-role operator
Enter AAA submode
Ips-role=administrator Ips-role=service
Enter the Radius server IP address
Specify the type of console authentication
Enter the IP address of the second Radius server
Exit AAA mode
Configuring Packet Command Restriction
AAA Radius Users
Sensorconfig-aut#permit-packet-logging true
Enter authentication submode
Check your new setting
Sensorconfig-aut#permit-packet-logging false
Creating the Service Account
Sensorconfig# user username privilege service
Configuring Passwords
Service Account and Radius Authentication
Radius Authentication Functionality and Limitations
Exit configuration mode
Change your password
Changing User Privilege Levels
Display your current level of privilege
Showing User Status
Change the privilege level from viewer to operator
Verify all users. The account of the user jsmith is locked
To unlock the account of jsmith, reset the password
Configuring the Password Policy
Example
Check that the setting has returned to the default
Set the value back to the system default setting
Locking User Accounts
Parentheses
Enter global configuration mode
Unlocking User Accounts
Unlock the account
Time Sources and the Sensor
Configuring Time
IPS Standalone Appliances
Correcting Time on the Sensor
Configuring Time on the Sensor
ASA IPS Modules
Displaying the System Clock
Manually Setting the System Clock
Symbol
Sensor# show clock
Enter start summertime submode
Configuring Recurring Summertime Settings
Enter the month you want to start summertime settings
Sensor# clock set 1321 Mar 29
Enter end summertime submode
Verify your settings
Enter the month you want to end summertime settings
Specify the local time zone used during summertime
Configuring Nonrecurring Summertime Settings
Exit recurring summertime submode
Exit non-recurring summertime submode
Exit time zone settings submode
Configuring NTP
Configuring Time Zones Settings
Sensorconfig-hos-tim#standard-time-zone-name CST
Configuring a Cisco Router to be an NTP Server
Example
Configure unauthenticated NTP Enter NTP configuration mode
Configuring the Sensor to Use an NTP Time Source
Enter service host mode
Verify the unauthenticated NTP settings
Verify the NTP settings
Configuring SSH
Configure authenticated NTP Enter NTP configuration mode
Exit NTP configuration mode
Understanding SSH
Adding Hosts to the SSH Known Hosts List
View the key for a specific IP address
Sensorconfig# ssh host-key
Add an entry to the known hosts list
Sensor# show ssh host-keys
Sensorconfig# no ssh host-key
Adding Authorized RSA1 and RSA2 Keys
Generating the RSA Server Host Key
Sensor# ssh generate-key
Sensor# show ssh server-key
Configuring TLS
Understanding TLS
Sensorconfig# tls trusted-host ip-address 10.89.146.110 port
Adding TLS Trusted Hosts
Remove an entry from the trusted hosts list
Displaying and Generating the Server Certificate
View the fingerprint for a specific host
Verify that the key was generated
Installing the License Key
Understanding the License Key
Service Programs for IPS Products
Obtaining and Installing the License Key
Installing the License Key
Licensing the ASA 5500-X IPS SSP
Verify the sensor is licensed
Verify the sensor key has been uninstalled
Uninstalling the License Key
Sensor# erase license-key
Setting Up the Sensor Installing the License Key
OL-29168-01
Configuring Interfaces
Interface Notes and Caveats
Understanding Interfaces
IPS Interfaces
Command and Control Interface
Sensor Command and Control Interface
Understanding Alternate TCP Reset Interfaces
TCP Reset Interfaces
Sensing Interfaces
Sensor Alternate TCP Reset Interface
Designating the Alternate TCP Reset Interface
2lists the alternate TCP reset interfaces
None
Interfaces Not
Interface Support
Base Chassis Cards Sensing Ports Inline Interface Pairs
Combinations Supporting Command and Control
Interface Configuration Restrictions
Configuring Interfaces Understanding Interfaces
Interface Configuration Sequence
Configuring Physical Interfaces
Specify the interface for promiscuous mode
Configuring the Physical Interface Settings
Display the list of available interfaces
Sensorconfig-int-phy#alt-tcp-reset-interface none
Remove TCP resets from an interface
Add a description of this interface
Understanding Promiscuous Mode
Configuring Promiscuous Mode
Exit interface submode
Configuring Promiscuous Mode
IPv6, Switches, and Lack of Vacl Capture
Understanding Inline Interface Mode
Configuring Inline Interface Mode
Set span 930, 932, 960, 962 4/1-4 both
Configuring Inline Interface Pairs
Creating Inline Interface Pairs
Display the available interfaces
Enable the interfaces assigned to the interface pair
Name the inline pair
It can monitor traffic see Step
Verify that the interfaces are enabled
Sensorconfig-int#no inline-interfaces PAIR1
Exit interface configuration submode
Verify the inline interface pair has been deleted
Configuring Inline Vlan Pair Mode
Understanding Inline Vlan Pair Mode
Configuring Inline Vlan Pairs
Configuring Inline Vlan Pairs
Been configured
OL-29168-01
Sensorconfig-int#no inline-interfaces interfacename
Set up the inline Vlan pair
Verify the inline Vlan pair settings
Designate an interface
Understanding Vlan Group Mode
Configuring Vlan Group Mode
To delete Vlan pairs Delete one Vlan pair
Deploying Vlan Groups
Configuring Vlan Groups
Configuring Inline Vlan Groups
None Subinterface-type
Specify an interface
Set up the Vlan group
Assign the VLANs to this group Assign specific VLANs
Verify the Vlan group settings
Configure unassigned VLANs
Add a description for the Vlan group
Understanding Inline Bypass Mode
Configuring Inline Bypass Mode
Delete Vlan groups Delete one Vlan group
Configuring Bypass Mode
Configuring Inline Bypass Mode
Configure bypass mode
Configuring Interface Notifications
Configuring Interface Notifications
Configuring CDP Mode
Sensorconfig-int#cdp-mode forward-cdp-packets
Enabling CDP Mode
Enable CDP mode
Displaying Interface Statistics
Sensor# show interfaces brief
Sensor# show interfaces Interface Statistics
Sensor# show interfaces Management0/0
Display the statistics for a specific interface
Clear the statistics
Sensor# show interfaces clear Interface Statistics
Displaying Interface Traffic History
Display the interface traffic history by the hour
Displaying Historical Interface Statistics
To display interface traffic history, follow these steps
Display the interface traffic history by the minute
Bytes Received Mbps
Configuring Virtual Sensors
Virtual Sensor Notes and Caveats
Understanding Virtual Sensors
Understanding the Analysis Engine
Advantages and Restrictions of Virtualization
Inline TCP Session Tracking Mode
Adding, Editing, and Deleting Virtual Sensors
Normalization and Inline TCP Evasion Protection Mode
Http Advanced Decoding
Restrictions
Adding Virtual Sensors
Add a virtual sensor
Sensorconfig-ana-vir#description virtual sensor
Adding a Virtual Sensor
Add a description for this virtual sensor
Assign an event action rules policy to this virtual sensor
Enable Http advanced decoding
Verify the virtual sensor settings
Assign a signature definition policy to this virtual sensor
Exit analysis engine mode
Edit the virtual sensor, vs1
Editing and Deleting Virtual Sensors
Editing or Deleting a Virtual Sensor
Edit the description of this virtual sensor
Sensorconfig-ana-vir#physical-interface GigabitEthernet0/2
Verify the edited virtual sensor settings
Delete a virtual sensor
Sensorconfig-ana# exit
Create the variable for the maximum number of open IP logs
Configuring Global Variables
Creating a Global Variable
Create the flow depth variable
Verify the global variable settings
Create the variable for service activity
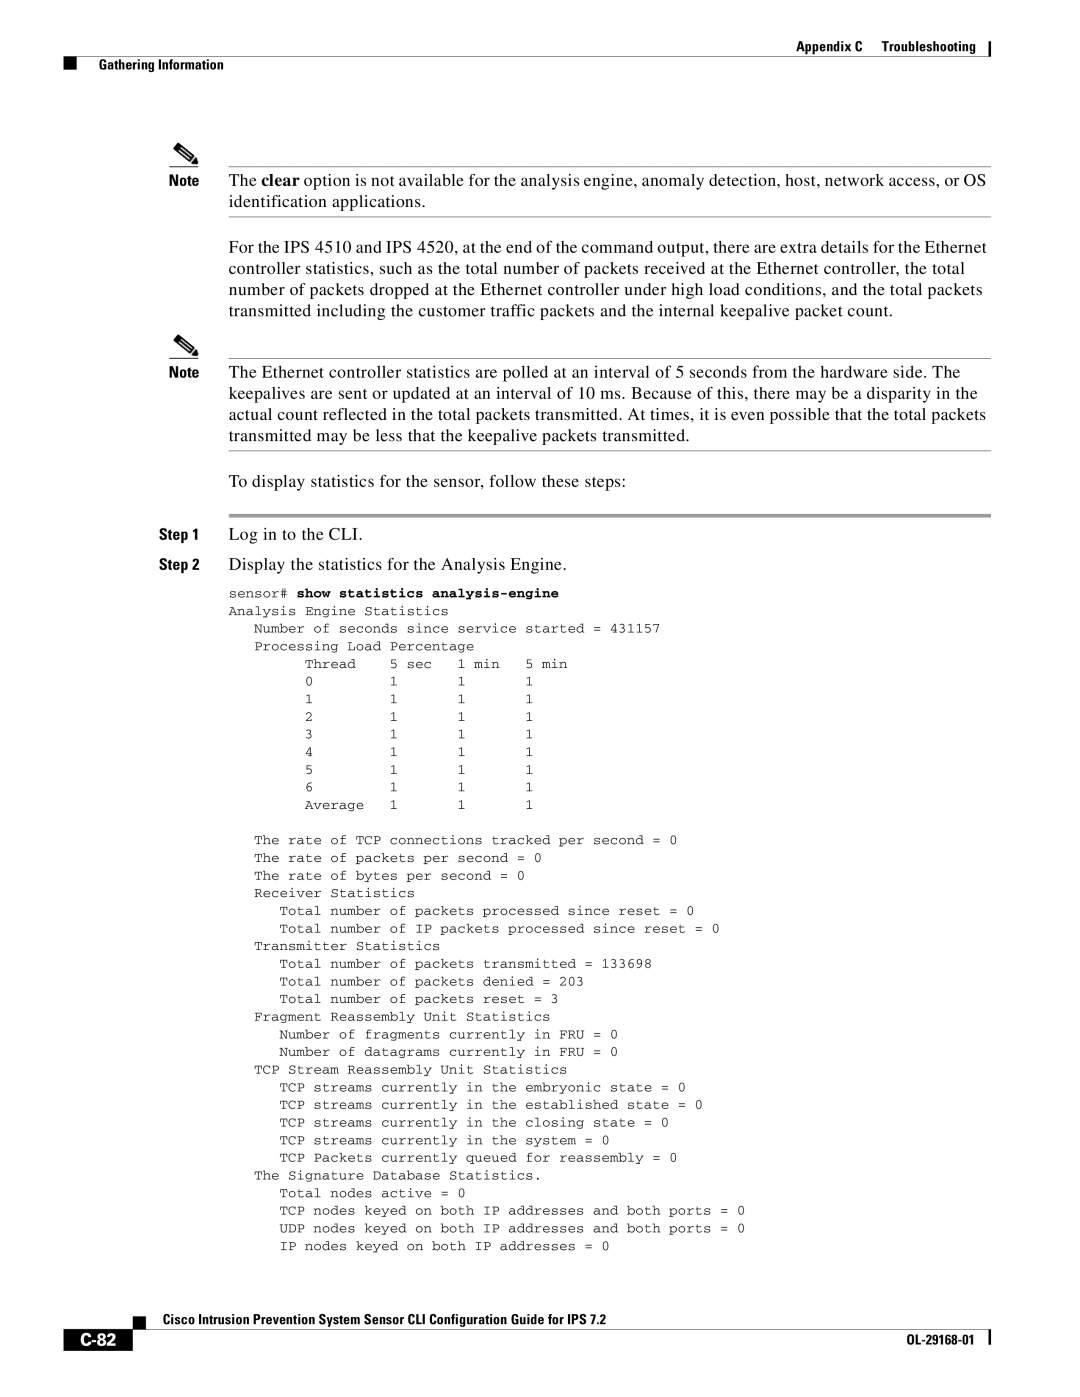
Sensor# show statistic analysis-engine
OL-29168-01
Signature Definition Notes and Caveats
Understanding Policies
Delete a signature definition policy
Sensor# list signature-definition-configurations
Working With Signature Definition Policies
Sensor# copy signature-definition sig0 sig1
Understanding Signatures
Reset a signature definition policy to factory settings
Confirm the signature definition policy has been deleted
Understanding Signature Variables
Configuring Signature Variables
Creating Signature Variables
Adding, Editing, and Deleting Signature Variables
Configuring Signatures
Signature Definition Options
Configuring Alert Frequency
Enter alert frequency submode
Configuring Alert Frequency
Specify the signature you want to configure
Specify the summary key
To configure the alert severity, follow these steps
Configuring Alert Severity
Configuring Alert Severity
Assign the alert severity
Configuring the Event Counter
Configuring the Event Counter
Exit signatures submode
Optional Enable alert interval
Enter event counter submode
Configuring the Signature Fidelity Rating
Configuring Signature Fidelity Rating
Specify the signature fidelity rating for this signature
Changing the Signature Status
Configuring the Status of Signatures
Choose the signature you want to configure
Change the status for this signature
Configuring Vulnerable OSes
Configuring the Vulnerable OSes for a Signature
Specify the vulnerable OSes for this signature
Assigning Actions to Signatures
Configure the event action
Configuring Event Actions
Specify the percentage for rate limiting
Understanding the AIC Engine
Configuring AIC Signatures
Exit event action submode
Configuring the Application Policy
AIC Engine and Sensor Performance
Enable Http application policy enforcement
Configuring the Application Policy
Enable inspection of FTP traffic
Sensorconfig-sig-app-htt#aic-web-ports 80-80,3128-3128
AIC Request Method Signatures
Signature ID Define Request Method
AIC Mime Define Content Type Signatures
Signature ID Signature Description
Signature ID Signature Description
Signature ID Signature Description
AIC Transfer Encoding Signatures
Signature ID Transfer Encoding Method
AIC FTP Commands Signatures
Signature ID FTP Command
Creating an AIC Signature
Specify the event action
Define the content type
Defining a MIME-Type Policy Signature
Define the signature type
Understanding IP Fragment Reassembly
Configuring IP Fragment Reassembly
Signature ID and Name Description Range Default Action
For More Information
Enter edit default signatures submode
Configuring IP Fragment Reassembly Parameters
Configuring the Method for IP Fragment Reassembly
Specify the engine
Configuring the IP Fragment Reassembly Method
Configuring TCP Stream Reassembly
Understanding TCP Stream Reassembly
Verify the setting
TCP Stream Reassembly Signatures and Configurable Parameters
TCP Stream Reassembly Signatures
SYN
SYN
Configuring TCP Stream Reassembly Signatures
Configuring the Mode for TCP Stream Reassembly
Sensorconfig-sig-str#tcp-3-way-handshake-required true
Configuring the TCP Stream Reassembly Parameters
Sensorconfig-sig-str#tcp-reassembly-mode strict
Specify the number of packets you want logged
Configuring IP Logging
Configuring IP Logging Parameters
Specify the length of time you want the sensor to log
Creating Custom Signatures
Sequence for Creating a Custom Signature
Example String TCP Engine Signature
Creating a String TCP Engine Signature
Verify the settings
Example Service Http Engine Signature
Specify a signature name
Creating a Service Http Engine Signature
Enter signature description mode
Specify the alert traits. The valid range is from 0 to
Exit alert frequency submode
Configure the Regex parameters
Example Meta Engine Signature
Exit Regex submode
Meta Signature Engine Enhancement
Defining Signatures Creating Custom Signatures
Creating a Meta Engine Signature
Example IPv6 Engine Signature
Specify IPv6
Sensorconfig-sig-sig#engine atomic-ip-advanced
Specify the IP version
Specify the L4 protocol
Example String XL TCP Engine Match Offset Signature
Creating a String XL TCP Engine Signature
Specify the regex string to search for in the TCP packet
Sensorconfig-sig-sig-str#specify-exact-match-offset yes
Specify the String XL TCP engine
Specify an exact match offset for this signature
Specify a minimum match offset for this signature
Example String XL TCP Engine Minimum Match Length Signature
Specify a signature ID and subsignature ID for the signature
Specify a new Regex string to search for and turn on UTF-8
OL-29168-01
Configuring Event Action Rules
Event Action Rules Notes and Caveats
Understanding Security Policies
Understanding Event Action Rules
Signature Event Action Processor
Alert and Log Actions
Action filter
Deny Actions
Other Actions
Understanding Deny Packet Inline
Event Action Rules Configuration Sequence
TCP Normalizer Signature Warning
Working With Event Action Rules Policies
Working With Event Action Rules Policies
Sensor# copy event-action-rules rules0 rules1
Delete an event action rules policy
Reset an event action rules policy to factory settings
Event Action Variables
Confirm the event action rules instance has been deleted
IPv4 Addresses
When configuring IPv6 addresses, use the following format
Understanding Event Action Variables
IPv6 Addresses
Adding, Editing, and Deleting Event Action Variables
Sensorconfig-eve#variables variable-ipv4 address
Working With Event Action Variables
Delete an event action rules variable
Verify that you added the event action rules variable
Verify that you edited the event action rules variable
Verify the event action rules variable you deleted
Configuring Target Value Ratings
Calculating the Risk Rating
Understanding Threat Rating
2illustrates the risk rating formula
Adding, Editing, and Deleting Target Value Ratings
Adding, Editing, and Deleting Target Value Ratings
Configuring Event Action Overrides
Understanding Event Action Overrides
Configuring Event Action Overrides
Write verbose alerts to Event Store
Log packets from both the attacker and victim IP addresses
Write an alert to Event Store
Write events that request an Snmp trap to the Event Store
Configuring Event Action Filters
Understanding Event Action Filters
Configuring Event Action Filters
OL-29168-01
Configuring Event Action Filters
Edit an existing filter
Verify the settings for the filter
Add any comments you want to use to explain this filter
Edit the parameters see Steps 4a through 4l
Move a filter to the inactive list
Sensorconfig-eve#filters move name1 inactive
Verify that the filter has been moved to the inactive list
Configuring OS Identifications
Understanding Passive OS Fingerprinting
Passive OS Fingerprinting Configuration Considerations
IOS
Adding, Editing, Deleting, and Moving Configured OS Maps
IP Address Range Set
Unix
Verify the settings for the OS map
Configuring OS Maps
Specify the host OS type
Verify that you have moved the OS maps
Enable passive OS fingerprinting
Edit an existing OS map
Move an OS map to the inactive list
Delete an OS map
Sensorconfig-eve-os#no configured-os-map name2
Displaying and Clearing OS Identifications
Verify that the OS map has been deleted
Verify that the OS IDs have been cleared
Configuring General Settings
Displaying and Clearing OS Identifications
Sensor# clear os-identification learned
Understanding Event Action Summarization
Understanding Event Action Aggregation
Enable or disable the summarizer. The default is enabled
Configuring the General Settings
Configuring Event Action General Settings
Enter general submode
Sensorconfig-eve-gen#global-filters-status enabled disabled
Configuring the Denied Attackers List
Verify the settings for general submode
Adding a Deny Attacker Entry to the Denied Attackers List
Remove the deny attacker entry from the list
Monitoring and Clearing the Denied Attackers List
Adding Entries to the Denied Attacker List
Enter yes to remove the deny attacker entry from the list
Displaying and Deleting Denied Attackers
Delete the denied attackers list
Clear only the statistics
Monitoring Events
Displaying Events
Important to know if the list has been cleared
To display events from the Event Store, follow these steps
Displaying Events
Sensor# show events
Display alerts from the past 45 seconds
Sensor# show events error warning 100000 Feb 9
Sensor# show events alert past
Enter yes to clear the events
Clearing Events from Event Store
Display events that began 30 seconds in the past
Sensor# show events past
OL-29168-01
Configuring Anomaly Detection
Anomaly Detection Notes and Caveats
Understanding Anomaly Detection
Understanding Worms
Anomaly Detection Modes
Anomaly Detection Zones
Anomaly Detection Configuration Sequence
Anomaly Detection Signatures
Signature ID Subsignature ID Name Description
Signature ID Subsignature ID Name Description
Working With Anomaly Detection Policies
Enable anomaly detection operational mode
Enabling Anomaly Detection
Exit analysis engine submode
Delete an anomaly detection policy
Working With Anomaly Detection Policies
Sensor# copy anomaly-detection ad0 ad1
Sensor# list anomaly-detection-configurations
Configuring Anomaly Detection Operational Settings
Reset an anomaly detection policy to factory settings
Verify that the anomaly detection instance has been deleted
Specify the worm timeout
Configuring the Internal Zone
Configuring Anomaly Detection Operational Settings
Sensorconfig-ano-ign#source-ip-address-range
Enable the internal zone
Configuring the Internal Zone
Configuring the Internal Zone
Configure TCP protocol Configure UDP protocol
Configuring Internal Zone TCP Protocol
Configuring TCP Protocol for the Internal Zone
Configure the other protocols
Enable TCP protocol
Verify the TCP configuration settings
Enable the service for that port
Them and configure your own scanner values
Set the scanner threshold
Configuring UDP Protocol for the Internal Zone
Verify the UDP configuration settings
Configuring the Internal Zone UDP Protocol
Enable UDP protocol
Associate a specific port with UDP protocol
Configuring Anomaly Detection Configuring the Internal Zone
Enable the other protocols
Configuring Other Protocols for the Internal Zone
Configuring the Internal Zone Other Protocols
Associate a specific number for the other protocols
Verify the other configuration settings
Configuring the Illegal Zone
Configuring the Illegal Zone
Configuring the Illegal Zone
Understanding the Illegal Zone
Enable the illegal zone
Configuring TCP Protocol for the Illegal Zone
Sensorconfig-ano-ill#ip-address-range
Configuring the Illegal Zone TCP Protocol
Enabled true defaulted Sensorconfig-ano-ill-tcp#
Configuring UDP Protocol for the Illegal Zone
Configuring the Illegal Zone UDP Protocol
Sensorconfig-ano-ill-udp-dst-yes# scanner-threshold
Configuring Other Protocols for the Illegal Zone
Configuring the Illegal Zone Other Protocols
Verify the other protocols configuration settings
Configuring the External Zone
Configuring the External Zone
Understanding the External Zone
Configuring the External Zone
Configuring TCP Protocol for the External Zone
Enable the external zone
Configuring the External Zone TCP Protocol
Sensorconfig-ano-ext-tcp#
Configuring UDP Protocol for the External Zone
Configuring the External Zone UDP Protocol
Sensorconfig-ano-ext-udp-dst-yes# scanner-threshold
Configuring Other Protocols for the External Zone
Configuring the External Zone Other Protocols
To configure other protocols for a zone, follow these steps
Configuring Learning Accept Mode
KB and Histograms
Example Histogram
Configuring Learning Accept Mode
Configuring Learning Accept Mode
Sensorconfig-ano#learning-accept-mode auto
Sensorconfig-ano#learning-accept-mode manual
Display the KB files for all virtual sensors
Working With KB Files
Displaying KB Files
Sensor# show ad-knowledge-base files
Manually Saving and Loading KBs
Saving and Loading KBs Manually
Display the KB files for a specific virtual sensor
Save the current KB file and store it as a new name
Copying, Renaming, and Erasing KBs
Rename a KB file
Copying, Renaming, and Removing KB Files
Remove a KB file from a specific virtual sensor
To compare two KBs, follow these steps
Displaying the Differences Between Two KBs
Comparing Two KBs
Locate the file you want to compare
Displaying the Thresholds for a KB
Displaying KB Thresholds
Sensor# show ad-knowledge-base vs1 files Virtual Sensor vs1
To display anomaly detection statistics, follow these steps
Displaying Anomaly Detection Statistics
Sensor# show statistics anomaly-detection vs0
Disabling Anomaly Detection
Display the statistics for all virtual sensors
Disable anomaly detection operational mode
OL-29168-01
Global Correlation Notes and Caveats
10-1
Participating in the SensorBase Network
Understanding Global Correlation
10-2
Type of Data Purpose
Understanding Reputation
1shows how we use the data
10-3
Understanding Network Participation
10-4
Understanding Efficacy
10-5
Understanding Reputation and Risk Rating
Global Correlation Features and Goals
10-6
Global Correlation Requirements
10-7
Understanding Global Correlation Sensor Health Metrics
10-8
Global Correlation Update Client
10-9
Turn on global correlation inspection
Configuring Global Correlation
Sensorconfig-glo#global-correlation-inspection on
Specify the level of global correlation inspection
Exit global correlation submode
Configuring Network Participation
Turn on reputation filtering
10-11
Enter yes to agree to participate in the SensorBase Network
Turning on Network Participation
Turn on network participation
10-12
Disabling Global Correlation
Troubleshooting Global Correlation
10-13
Disabling Global Correlation
Displaying Global Correlation Statistics
10-14
Clear the statistics for global correlation
10-15
10-16
Understanding External Product Interfaces
External Product Interface Notes and Caveats
11-1
Understanding the CSA MC
11-2
External Product Interface Issues
11-3
Adding External Product Interfaces and Posture ACLs
Configuring the CSA MC to Support the IPS Interface
11-4
Adding External Product Interfaces
11-5
11-6
Enter the network address the posture ACL will use
Sensorconfig-ext-cis-hos#allow-unreachable-postures yes
Sensorconfig-ext-cis-hos#posture-acls insert name1 begin
Choose the action deny or permit the posture ACL will take
Exit external product interface submode
Troubleshooting External Product Interfaces
11-8
IP Logging Notes and Caveats
12-1
Understanding IP Logging
Configuring Automatic IP Logging
12-2
Configuring Automatic IP Logging
12-3
12-4
Configuring Manual IP Logging
Monitor the IP log status with the iplog-status command
Sensor# iplog vs0 192.0.2.1 duration
Displaying the Contents of IP Logs
Disabling IP Logging Sessions
Stopping Active IP Logs
Display a brief list of all IP logs
Stop the IP log session
Copying IP Log Files
Copying IP Log Files to Be Viewed
Stop all IP logging sessions on a virtual sensor
12-7
Copy the IP log to your FTP or SCP server
12-8
Packet Display And Capture Notes and Caveats
13-1
Displaying Live Traffic on an Interface
Understanding Packet Display and Capture
13-2
13-3
Displaying Live Traffic From an Interface
Sensor# packet display GigabitEthernet0/1
13-4
Capturing Live Traffic on an Interface
Display information about the packet file
Expression ip proto \\tcp
13-5
Capturing Live Traffic on an Interface
View the captured packet file
Sensor# packet capture GigabitEthernet0/1
View any information about the packet file
Copying the Packet File
13-6
Erase the packet file
View the packet file with Wireshark or Tcpdump
Erasing the Packet File
Verify that you have erased the packet file
13-8
Blocking Notes and Caveats
14-1
Understanding Blocking
14-2
Vlan B
14-3
Data
Understanding Rate Limiting
Destination IP Signature ID Signature Name Protocol
Icmp
UDP
Understanding Service Policies for Rate Limiting
Before Configuring ARC
TCP
Supported Devices
14-6
Configuring Blocking Properties
14-7
Allowing the Sensor to Block Itself
Enter network access submode
Sensorconfig# service network-access
14-8
Disabling Blocking
Configure the sensor not to block itself
Exit network access submode
14-9
Enable blocking on the sensor
Blocks on the devices are updated
To disable blocking or rate limiting, follow these steps
Verify that the setting has been returned to the default
Specifying Maximum Block Entries
14-11
Change the maximum number of block entries
Return to the default value of 250 blocks
Sensorconfig-net-gen#default block-max-entries
14-12
Signatures
Time for manual blocks is set when you request the block
Specifying the Block Time
These steps
Enabling ACL Logging
14-14
Enabling Writing to Nvram
14-15
Verify that writing to Nvram is disabled
Logging All Blocking Events and Errors
Disable writing to Nvram
14-16
Configuring the Maximum Number of Blocking Interfaces
14-17
Specify the maximum number of interfaces
Return the setting to the default
Verify the default setting
Verify the number of maximum interfaces
Sensorconfig-net-gen#never-block-hosts
Configuring Addresses Never to Block
Configuring Addresses Never to Be Blocked
For a network
Create the user profile name
Configuring User Profiles
Specify the password for the user
Enter the username for that user profile
How the Sensor Manages Devices
Configuring Blocking and Rate Limiting Devices
Specify the enable password for the user
14-21
Configuring the Sensor to Manage Cisco Routers
14-22
Specify the IP address for the router controlled by the ARC
Routers and ACLs
14-23
14-24
Switches and VACLs
14-25
Sensorconfig-net-cat#communication telnet ssh-3des
14-26
Optional Add the pre-VACL name
Configuring the Sensor to Manage Cisco Firewalls
Specify the Vlan number
Optional Add the post-VACL name
Configuring the Sensor to be a Master Blocking Sensor
14-28
Sensorconfig-web# exit
Configuring the Master Blocking Sensor
14-29
Add a master blocking sensor entry
Sensorconfig# tls trusted-host ip-address 192.0.2.1 port
Enter password
Specify whether or not the host uses TLS/SSL
Blocking a Host
Configuring Host Blocking
Configuring Network Blocking
End the host block
End the network block
Configuring Connection Blocking
Blocking a Network
14-32
End the connection block
Obtaining a List of Blocked Hosts and Connections
Blocking a Connection
Blocks are
14-34
Understanding Snmp
Snmp Notes and Caveats
15-1
Configuring Snmp
15-2
Configuring Snmp General Parameters
15-3
Exit notification submode
Configuring Snmp Traps
15-4
Specify whether you want detailed Snmp traps
Configuring Snmp Traps
Enable Snmp traps
Enter the trap community string
CISCO-CIDS-MIB
CISCO-ENHANCED-MEMPOOL-MIB CISCO-ENTITY-ALARM-MIB
Supported Mibs
15-6
15-7
15-8
Displaying the Current Configuration
16-1
First Review Cisco Confidential
16-2
Displaying the Current Submode Configuration
16-3
16-4
16-5
16-6
16-7
Sensorconfig# service health-monitor
16-8
16-9
16-10
16-11
16-12
Severity warning defaulted protected entry zone-name csi
16-13
16-14
Sensorconfig# service trusted-certificate
16-15
Filtering the Current Configuration Output
16-16
Press Ctrl-Cto stop the output and return to the CLI prompt
Filtering Using the More Command
To filter the more command, follow these steps
16-17
Filtering the Submode Output
Filtering the Current Submode Configuration Output
16-18
Displaying the Contents of a Logical File
Displaying the Logical File Contents
16-20
16-21
16-22
Restoring the Current Configuration From a Backup File
Backing Up the Current Configuration to a Remote Server
16-23
Erasing the Configuration File
Creating and Using a Backup Configuration File
16-24
Press Enter to continue or enter no to stop
16-25
16-26
Administrative Tasks for the Sensor
17-1
Understanding Password Recovery
Administrative Notes and Caveats
Recovering the Password
17-2
Platform Description Recovery Method
Recovering the Password for the Appliance
Using the Grub Menu
17-3
Enter the following commands to reset the password
Recovering the Password for the ASA 5500-X IPS SSP
Using Rommon
Sample Rommon session
Session to the ASA 5500-X IPS SSP
Enter your new password twice
Press Enter to confirm
17-5
Asa# hw-module module 1 password-reset
Recovering the Password for the ASA 5585-X IPS SSP
Using the Asdm
17-6
17-7
Session to the ASA 5585-X IPS SSP
Asa# show module
Disabling Password Recovery Using the IDM or IME
Disabling Password Recovery
Disabling Password Recovery Using the CLI
17-8
Sensorconfig-hos#show settings include password
Verifying the State of Password Recovery
Troubleshooting Password Recovery
Clearing the Sensor Databases
Enter yes to clear the inspectors database
Clearing the Sensor Database
17-10
Show the histogram of the inspection load
Displaying the Inspection Load of the Sensor
Over the past 60 minutes and over the past 72 hours
17-11
17-12
Configuring Health Status Information
17-13
Platform Yellow Red Memory Used
Configuring Health Statistics
ASA 5500-X IPS SSP and Memory Usage
17-14
17-15
Set the missed packet threshold
Set the number of days since the last signature update
Set the threshold for memory usage
17-16
Exit health monitoring submode
Showing Sensor Overall Health Status
17-17
Show the health and security status of the sensor
Creating a Banner Login
Create the banner login
Enter your message
To terminate a CLI session, follow these steps
Find the CLI ID number associated with the login session
Terminating CLI Sessions
Terminate the CLI session of jsmith
Modifying Terminal Properties
Configuring Events
17-20
17-21
17-22
Clearing Events from the Event Store
17-23
17-24
Configuring the System Clock
Displaying the System Clock
Sensor# show clock detail
Clearing the Denied Attackers List
Manually Setting the System Clock
17-25
17-26
Displaying Policy Lists
17-27
Display the list of policies for signature definition
Displaying Statistics
Display the list of policies for event action rules
17-28
Administrative Tasks for the Sensor
17-29
17-30
Display the statistics for anomaly detection
Display the statistics for authentication
Sensor# show statistics authentication
17-31
17-32
Display the statistics for the Event Server
Display the statistics for the Event Store
Sensor# show statistics event-server General
17-33
Display the statistics for the host
Show statistics host
17-34
Display the statistics for the logging application
Display the statistics for the ARC
Sensor# show statistics logger
17-35
17-36
17-37
17-38
Display the statistics for the web server
Statistics web-server
17-39
Sensor# show statistics logger clear
Displaying Tech Support Information
Displaying Tech Support Information
Varlog Files
17-40
17-41
Displaying Version Information
View version information
Sensor# show version
View configuration information
Cancel the output and get back to the CLI prompt
17-42
Diagnosing Network Connectivity
17-43
Following example shows a successful ping
Resetting the Appliance
Enter yes to continue the reset
Following example shows an unsuccessful ping
Enter yes to continue with the reset and power down
Displaying Command History
Stop all applications and power down the appliance
17-45
17-46
Displaying Hardware Inventory
Sensor# show inventory
17-47
PID IPS-4360-PWR-AC
17-48
Tracing the Route of an IP Packet
Display the route of IP packet you are interested
Inventory
Sensor config# service network-access
Displaying Submode Settings
Show the current configuration for ARC submode
17-49
17-50
Show the ARC settings in terse mode
17-51
17-52
Configuring the ASA 5500-X IPS SSP
18-1
Configuration Sequence for the ASA 5500-X IPS SSP
18-2
Confirm the information
Verifying Initialization for the ASA 5500-X IPS SSP
Obtain the details about the ASA 5500-X IPS Ssps
18-3
Creating Virtual Sensors
Creating Virtual Sensors for the ASA 5500-X IPS SSP
ASA 5500-X IPS SSP and Virtualization
18-4
Creating Virtual Sensors
18-5
Sensorconfig-ana-vir#physical-interface PortChannel0/0
18-6
18-7
Assigning Virtual Sensors to Contexts
Asa# show ips
Assign virtual sensors to the security contexts
Enter multiple mode
Add three context modes to multiple mode
18-8
Confirm the configuration
ASA 5500-X IPS SSP and Bypass Mode
Configure MPF for each context
SensorApp Fails
ASA 5500-X IPS SSP and the Normalizer Engine
SensorApp is Reconfigured
18-10
ASA 5500-X IPS SSP and Memory Usage
ASA 5500-X IPS SSP and Jumbo Packets
18-11
Health and Status Information
18-12
Asa-ips#debug module-boot
18-13
Early reservations == bootmem 0000000000
18-14
18-15
18-16
18-17
18-18
18-19
IRQ
Two ASAs in Fail-Open Mode
Single ASA in Fail-Open Mode
Single ASA in Fail-Close Mode
ASA 5500-X IPS SSP Failover Scenarios
Configuration Examples
New and Modified Commands
Two ASAs in Fail-Close Mode
18-21
Allocate-ips
Defaults
Firewall Mode Security Context Multiple Command Mode Routed
Single Context System
Examples
Command History Release Modification
Related Commands Description
18-23
18-24
ASA 5585-XIPS SSP Notes and Caveats
19-1
Configuration Sequence for the ASA 5585-X IPS SSP
19-2
19-3
Verifying Initialization for the ASA 5585-X IPS SSP
Obtain the details about the ASA 5585-X IPS SSP
Asa# show module 1 details
ASA 5585-X IPS SSP and Virtualization
Creating Virtual Sensors for the ASA 5585-X IPS SSP
19-4
ASA 5585-X IPS SSP Virtual Sensor Configuration Sequence
19-5
Virtual sensor that you create
Command, for example sig1
Example, rules1
19-6
19-7
Asaconfig-ctx# Config-url disk0/c2.cfg
Asaconfig-ctx#
19-8
19-9
ASA 5585-X IPS SSP and the Normalizer Engine
ASA 5585-X IPS SSP and Bypass Mode
19-10
ASA 5585-X IPS SSP and Jumbo Packets
19-11
Ips-ssp#hardware-module module 1 recover configure
19-12
19-13
Asa# hw-module module 1 reset
Module 1 details
Ips-ssp#hw-module module 1 recover configure
19-14
Asaconfig# debug module-boot
Traffic Flow Stopped on IPS Switchports
19-15
Failover Scenarios
19-16
19-17
19-18
Obtaining Cisco IPS Software
IPS 7.2 File List
20-1
Downloading Cisco IPS Software
Enter your username and password
IPS Software Versioning
20-2
Service Pack
Major Update
Minor Update
Patch Release
Signature Engine Update
Signature Update
20-4
Recovery and System Image Files
20-5
IPS Software Release Examples
20-6
Accessing IPS Documentation
20-7
Cisco Security Intelligence Operations
20-8
Upgrade Notes and Caveats
21-1
Upgrades, Downgrades, and System Images
21-2
IPS 7.21E4 Files
Supported FTP and HTTP/HTTPS Servers
Upgrading the Sensor
21-3
Manually Upgrading the Sensor
Upgrade Notes and Caveats
21-4
Sensorconfig# upgrade url/IPS-SSP10-K9-7.2-1-E4.pkg
Upgrade the sensor
Enter the password when prompted
Upgrading the Sensor
Working With Upgrade Files
21-6
Upgrading the Recovery Partition
21-7
Enter the server password. The upgrade process begins
Configuring Automatic Upgrades
Configuring Automatic Updates
21-8
21-9
Configuring Automatic Upgrades
21-10
Exit automatic upgrade submode
Specify the username for authentication
Specify the password of the user
21-11
21-12
Applying an Immediate Update
Sensor# autoupdatenow
Sensor# show statistics host
Downgrading the Sensor
Recovering the Application Partition
21-13
Recover the application partition image
Installing System Images
Recovering the Application Partition Image
Sensorconfig# recover application-partition
Tftp Servers
Connecting an Appliance to a Terminal Server
21-15
Installing the System Image for the IPS 4345 and IPS
21-16
21-17
PCI
21-18
Assign the Tftp server IP address
If necessary, assign the gateway IP address
Rommon ping server
Rommon
Installing the System Image for the IPS 4510 and IPS
21-19
21-20
If necessary, assign the Tftp server IP address
21-21
Image the ASA 5500-X IPS SSP
Installing the System Image for the ASA 5500-X IPS SSP
Periodically check the recovery until it is complete
21-22
Installing the System Image for the ASA 5585-X IPS SSP
21-23
21-24
Asa# hw-module module 1 recover boot
Specify the default gateway of the ASA 5585-X IPS SSP
To enable debugging of the software installation process
Leave the Vlan ID at
Installing the ASA 5585-X IPS SSP System Image Using Rommon
21-26
21-27
Rommon #0 set
21-28
21-29
21-30
Understanding the IPS System Architecture
IPS System Design
Figure A-1illustrates the system design for IPS software
System Applications
Figure A-2 System Design for IPS 4500 Series Sensors
Appendix a System Architecture System Applications
Security Features
For detailed information about SDEE, see SDEE, page A-33
MainApp Responsibilities
MainApp
Understanding the MainApp
ARC
Event Store
Understanding the Event Store
Table A-1shows some examples
Event Data Structures
Stamp Value Meaning
NotificationApp
IPS Events
Vlan
CtlTransSource
PEP
Attack Response Controller
Figure A-3
Understanding the ARC
Figure A-4illustrates the ARC
ARC Features
Supported Blocking Devices
Maintaining State Across Restarts
ACLs and VACLs
Fwsm
Connection-Based and Unconditional Blocking
Scenario
To clear all blocks
Blocking with Cisco Firewalls
To unblock an IP address
No shun ip
Blocking with Catalyst Switches
Logger
Authenticating Users
AuthenticationApp
Understanding the AuthenticationApp
Configuring Authentication on the Sensor
Managing TLS and SSH Trust Relationships
SensorApp
Web Server
Understanding the SensorApp
Inline, Normalization, and Event Risk Rating Features
SensorApp New Features
Packet Flow
Signature Event Action Processor
CollaborationApp
Update Components
SwitchApp
Error Events
CLI
User Roles
Service Account
Communications
Idapi
Idconf
Cisco IPS File Structure
Cidee
Application Description
Using the Idapi
Summary of Cisco IPS Applications
CLI
IME
IDM
Java applet that provides an Html IPS management interface
Events
Signature Engines
Understanding Signature Engines
Appendix B Signature Engines Understanding Signature Engines
Appendix B Signature Engines Understanding Signature Engines
Parameter Description Value
Master Engine
General Parameters
Signature-id Specifies the ID of this signature
Sig-name
Promiscuous Delta
Obsoletes
Alert Frequency
Vulnerable OS List
Event Actions
Name Description
\NNN
AIC Engine
To Match Regular Expression
AIC Engine and Sensor Performance
Understanding the AIC Engine
AIC Engine Parameters
Alarm-on-non-http-traffic
Parameter Description
Table B-6 AIC FTP Engine Parameters
Atomic Engine
Atomic ARP Engine
Atomic IP Advanced Engine
Isatap
Atomic IP Advanced Engine Restrictions
String
IPv6
Parameter Description Value
OL-29168-01
IPV4
Icmp ID
L4 Protocol ICMPv6
L4 Protocol TCP and UDP
OL-29168-01
Atomic IP Engine
Parameter Description Value
Appendix B Signature Engines
OL-29168-01
Atomic IPv6 Engine
Atomic IPv6 Signatures
Fixed Engine
Table B-11 Fixed TCP Engine Parameters
Flood Engine
Protocol Specifies which kind of traffic to inspect
Meta Engine
Flood Net Engine Parameters
Component-list Specifies the Meta engine component
Name1
Multi String Engine
Normalizer Engine
TCP Normalization
IP Fragmentation Normalization
IPv6 Fragments
ASA IPS Modules and the Normalizer Engine
Service Engines
Understanding the Service Engines
Service DNS Engine
Service FTP Engine
Service Generic Engine
Table B-20 Service Generic Engine Parameters
Service H225 Engine
ASN.1-PER
Setup
Setup
Tpkt
Service Http Engine
Crlfcrlf
Service Ident Engine
Service Msrpc Engine
Smbcomtransaction
Service Mssql Engine
Service NTP Engine
Service P2P Engine
Service RPC Engine
Parameter Description Value
Service SMB Advanced Engine
Msrpc Uuid
Service Snmp Engine
Service SSH Engine
Specify-object-id-Enables
Service TNS Engine
State Engine
Table B-32lists the parameters specific to the State engine
String Engines
Table B-33 String Icmp Engine Parameters
Table B-35 String UDP Engine
String XL Engines
Parameter Description Value
Unsupported String XL Parameters
Sweep Engine
Sweep Engines
Data Nodes
Type
Sweep Other TCP Engine
Traffic Anomaly Engine
Sweep Other TCP Engine Parameters
Signature
Traffic Icmp Engine
Trojan Engines
Troubleshooting
Bug Toolkit
Understanding Preventive Maintenance
Preventive Maintenance
Creating and Using a Backup Configuration File
Sensor# copy current-config backup-config
Backing Up the Current Configuration to a Remote Server
Creating the Service Account
Disaster Recovery
Password Recovery
Security appliance IPS modules Command
ASA 5500 series adaptive Adaptive security appliance CLI
Using Rommon
Password-Reset issued for module ips
Recovering the Password for the ASA 5585-X IPS SSP
0123 21E4
Disabling Password Recovery
Verifying the State of Password Recovery
Time Sources and the Sensor
For the procedure for configuring NTP, see Configuring NTP,
Synchronizing IPS Clocks with Parent Device Clocks
Generate the host statistics
Verifying the Sensor is Synchronized with the NTP Server
Generate the hosts statistics again after a few minutes
Advantages and Restrictions of Virtualization
TFor More Information
When to Disable Anomaly Detection
To learn more about Worms, see Understanding Worms,
Analysis Engine Not Responding
Reboot the sensor
Command output
Enter show tech-support and save the output
External Product Interfaces Issues
External Product Interfaces Troubleshooting Tips
Troubleshooting the Appliance
Troubleshooting Loose Connections
Communication Problems
Analysis Engine is Busy
Cannot Access the Sensor CLI Through Telnet or SSH
More
Correcting a Misconfigured Access List
Sensor# show configuration include access-list
Duplicate IP Address Shuts Interface Down
Make sure the sensor cabling is correct
SensorApp is Not Running
SensorApp and Alerting
Make sure the IP address is correct
AnalysisEngine 20130410110072014 Release
Physical Connectivity, SPAN, or Vacl Port Issue
Unable to See Alerts
Sensor# show interfaces
Check for alerts
Make sure you have Produce Alert configured
Sensor# show interfaces FastEthernet0/1
Sensor Not Seeing Packets
Sensorconfig-int#physical-interfaces GigabitEthernet0/1
Sensor# show interfaces GigabitEthernet0/1
Check to see that the interface is up and receiving packets
Cleaning Up a Corrupted SensorApp Configuration
Exit the service account Log in to the sensor CLI
Replace the virtual sensor file
Blocking
Troubleshooting Blocking
Start the IPS services
Sensor# cids start
Verifying the ARC is Running
Sensor# show events error hhmmss month day year include nac
If the ARC is not connecting, look for recurring errors
Make sure you have the latest software updates
Sensor# show events error 000000 Apr 01 2011 include nac
For More Information
Device Access Issues
Verify the IP address for the managed devices
Sensorname Sensor Management Time-Based Actions Host Blocks
Start the manual block of the bogus host IP address
Enabling SSH Connections to the Network Device
Blocking Not Occurring for a Signature
Verifying the Master Blocking Sensor Configuration
Exit network access general submode
Logging
Enable debug logging for all zones
Enabling Debug Logging
Exit master zone control
Turn on individual zone control
View the zone names
Protected entry zone-name nac
Turn on debugging for a particular zone
Exit the logger submode
Table C-2lists the debug logger zone names
Zone Names
Press Enter to apply changes or type no to discard them
Zone Name Description
Directing cidLog Messages to SysLog
TCP Reset Not Occurring for a Signature
Make sure the correct alarms are being generated
Software Upgrades
Upgrading Error
Sensor# show events alert
Which Updates to Apply and Their Prerequisites
Issues With Automatic Update
Updating a Sensor with the Update Stored on the Sensor
Cannot Launch the IDM Loading Java Applet Failed
Troubleshooting the IDM
Click the Advanced tab
Cannot Launch the IDM-The Analysis Engine Busy
Delete the temp files and clear the history in the browser
Troubleshooting the IME
Signatures Not Producing Alerts
Not Supported Error Message
Troubleshooting the ASA 5500-X IPS SSP
Time Synchronization on IME and the Sensor
Health and Status Information
E1000 00000005.0 PCI INT a disabled
303
Appendix C Troubleshooting
Usb
CRS
IRQ
Failover Scenerios
ASA 5500-X IPS SSP and the Normalizer Engine
ASA 5500-X IPS SSP and Memory Usage
ASA 5500-X IPS SSP and Jumbo Packets
Troubleshooting the ASA 5585-X IPS SSP
Hw-module module 1 reset command
Reset issued for module in slot Asa# show
Mgmt IP addr 192.0.2.3
Failover Scenarios
Traffic Flow Stopped on IPS Switchports
ASA 5585-X IPS SSP and the Normalizer Engine
Gathering Information
ASA 5585-X IPS SSP and Jumbo Packets
Health and Network Security Information
Tech Support Information
Understanding the show tech-support Command
Displaying Tech Support Information
Tech Support Command Output
Sensor# show tech-support page System Status Report
= No
Version Information
Understanding the show version Command
Displaying Version Information
Version 29.1 Platform IPS4360 Serial Number
Service aaa
Statistics Information
Understanding the show statistics Command
Displaying Statistics
Percentage Thread Sec Min Average
Inspection Stats Inspector Active Call Create Delete
Display the statistics for anomaly detection
Sensor# show statistics event-server
Sensor# show statistics denied-attackers
Sensor# show statistics event-store
Threat
Multicast MTU1500 Metric1
Appendix C Troubleshooting Gathering Information
Display the statistics for the notification application
Name Current
OL-29168-01
Sensor# show statistics web-server listener-443
Understanding the show interfaces Command
Interfaces Information
Interfaces Command Output
Displaying Interface Traffic History
Avg Load Peak Load
GigabitEthernet0/1 Time Packets Received Bytes Received Mbps
Events Information
Sensor Events
Understanding the show events Command
Displaying Events
Displaying Events
100
Clearing Events
CidDump Script
101
102
Uploading and Accessing Files on the Cisco FTP Site
Enter the following command
Usr/cids/idsRoot/bin/cidDump
Reason Command
CLI Error Messages
URI
Error Message Reason Command
Been captured
System that has not been upgraded
Packet-file but no packet-file has
User attempted to downgrade a
Log in when the maximum number
User attempted to cancel a CLI
Operator or viewer user attempted to Initial login
Administrator user attempted to log Initial login
Appendix D CLI Error Messages
CLI Validation Error Messages
Reason/Location
Added to the virtual sensor entry physical
Detection configuration file that is currently in use
Interface and optional sub-interface being
Interface set has already been assigned to another
OL-29168-01
GL-1
To detect worm-infected hosts
GL-2
GL-3
Authoritative private key
Certificate for one CA issued by another CA
GL-4
GL-5
GL-6
To the transmit line and reads data from the receive line
Dual In-line Memory Modules
A public outside network
802.1q to be used
GL-8
An ITU standard that governs H.245 endpoint control
Procedures, and basic data transport methods
GL-9
GL-10
GL-11
GL-12
Detailed information about signatures
Proprietary branches
GL-13
GL-14
GL-15
Quality and service availability
GL-16
GL-17
Analysis Engine
Network devices. Used with the IDS MC
Unauthorized activity
GL-18
GL-19
GL-20
Local system. Telnet is defined in RFC
Authorization, and accounting
Network asset through its IP address
GL-21
GL-22
Version identifier. Part of the UDI
Through a switch. Also known as security ACLs
RFC
GL-23
GL-24
Hosts
Payload reassembly
GL-25
GL-26
AIC Http
AIC FTP
IN-1
IN-2
ARP
NAT
TACACS+
IN-3
SSP
Asdm
IN-4
Radius
IN-5
URL Cidee
BO2K
IN-6
Exec
IN-7
IN-8
IN-9
IN-10
CSA MC
IN-11
TFN
IN-12
AIC FTP AIC Http
IN-13
IN-14
IN-15
Idconf
Idapi
IN-16
ASA 5500-X IPS SSP ASA 5585-X IPS SSP
Idiom
IN-17
Tcpdump
IN-18
IPS SSP
IN-19
Loki
SSH
IN-20
Snmp
IN-21
IN-22
IN-23
IN-24
Http A-33
RTT
Sdee
IN-25
IN-26
IN-27
AIC
IN-28
Smtp
Cidee Idconf Idiom Sdee
IN-29
IN-30
TLS
TAC
TFN2K
IN-31
BO2K Loki TFN2K
IN-32
Sensing process not running
Upgrade command
Sensor initialization Sensor setup Version display
Viewer role privileges
IN-34