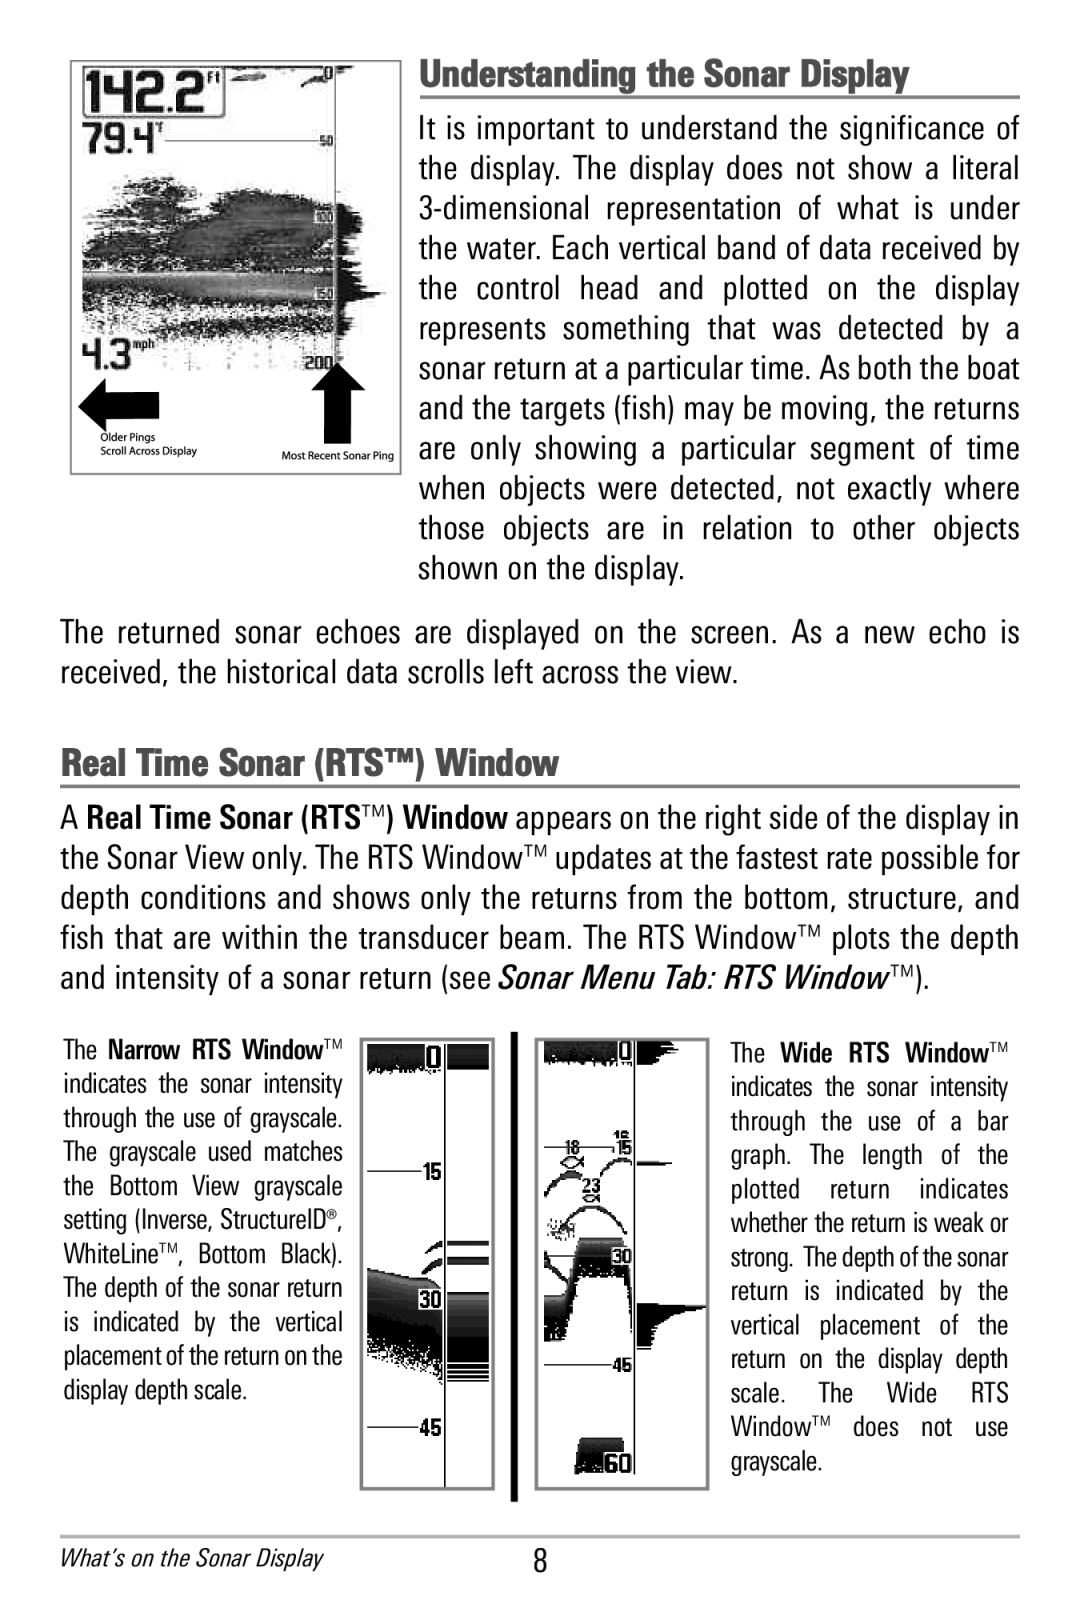
Understanding the Sonar Display
It is im portant to understand the significance of the display. The d isplay d oes n ot sh ow a literal
The returned sonar echoes ar e displa yed on the screen. As a new ec ho is received, the historical data scrolls left across the view.
Real Time Sonar (RTS™) Window
A Real Time Sonar (RTS™) Window appears on the right side of the display in the Sonar View only. The RTS Window™ updates at the fastest rate possible for depth conditions and shows only the returns from the bottom, structure, and fish that are within the transducer beam . The RTS Wind ow™ plots the depth and intensity of a sonar return (see Sonar Menu Tab: RTS Window™).
The Narrow RTS Window™ indicates the sonar intensity through the use of grayscale. The g rayscale used ma tches the Bottom View grays cale setting (Inverse, StructureID®, WhiteLine™, Bo ttom Blac k). The depth of the sonar return is indicated by t he ver tical placement of the return on the display depth scale.
The Wide R TS W indow™ indicates t he so nar i ntensity through the u se of a ba r graph. The length of the plotted r eturn indicates whether the return is weak or strong. The depth of the sonar return is in dicated by th e vertical p lacement of th e return o n the d isplay d epth
scale. The Wide RT | S |
Window™ does n ot us | e |
grayscale. |
|
What’s on the Sonar Display | 8 |
