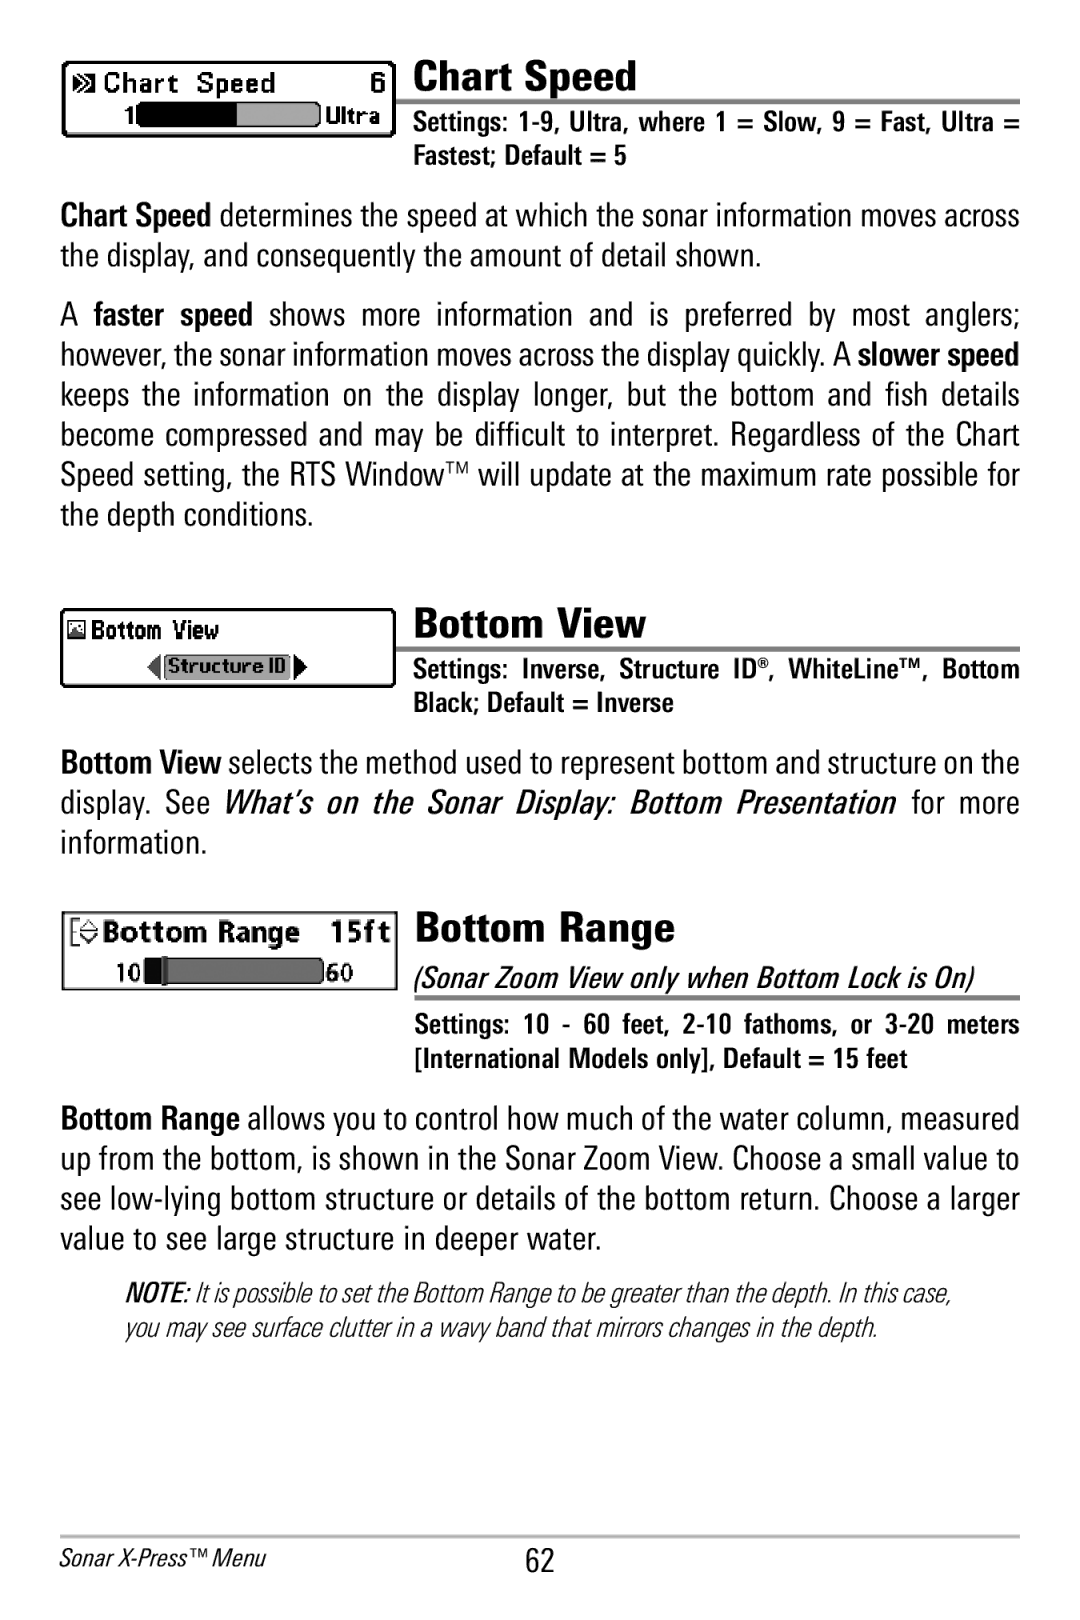
Chart Speed
Settings:
Fastest; Default = 5
Chart Speed determines the speed at which the sonar information moves across the display, and consequently the amount of detail shown.
A faster speed shows more information and is preferr ed by most ang lers; however,the sonar information movesacross the display quickly. A slower speed keeps th e i nformation on the display longer, but t he bottom and fi sh details become compressed and may be dif ficult to interpret. Regardless of the Chart Speed setting, the RTS Window™ will update at the maximum rate possible for the depth conditions.
 Bottom View
Settings: Inver se, Structure I D®, WhiteLine™, Bottom
Black; Default = Inverse
Bottom View selects the method used to represent bottom and structure on the display. See What’s on the Sonar Dis play: Bo ttom Pr esentation for more information.
Bottom Range
(Sonar Zoom View only when Bottom Lock is On)
Settings: 10 - 6 0 feet,
Bottom Range allows you to control how much of the water column, measured up from the bottom, is shown in the Sonar Zoom View. Choose a small value to see
NOTE: It is possible to set the Bottom Range to be greater than thedepth. In this case, you may see surface clutter in a wavy band that mirrorschanges in the depth.
Sonar | 62 |
