Bottom Presentation
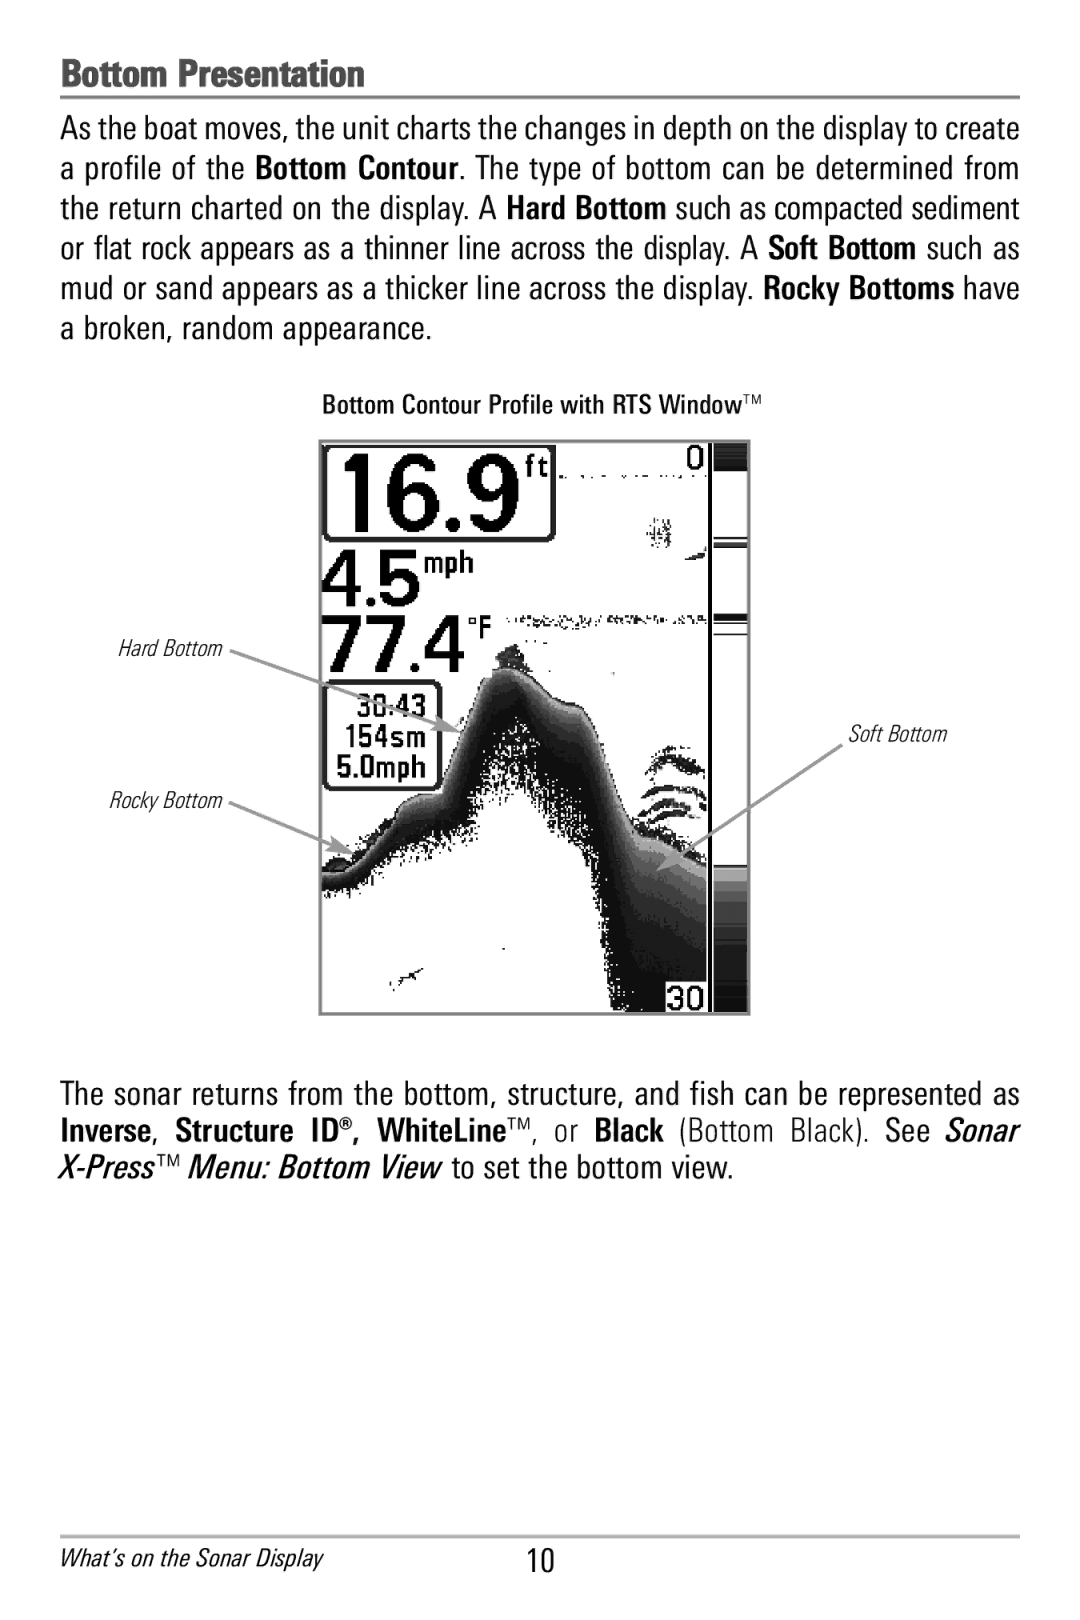
As the boat moves, the unit charts the changes in depth on the display to create
aprofile of the Bottom Contour. The type of b ottom can be d etermined from the return charted on the display. A Hard Bottom such as compacted sediment or flat rock appears as a thinner line across the display. A Soft Bottom such as mud or sand appears as a thicker line across the display. Rocky Bottoms have a broken, random appearance.
Bottom Contour Profile with RTS Window™
Hard Bottom
Rocky Bottom ![]()
Soft Bottom
The sonar returns from the bott om, structure, and fish can be represented as Inverse, Structure ID® , WhiteLin e™, o r Black (Bottom Black). See Sonar
What’s on the Sonar Display | 10 |
