3.The Sensitivity Control Bar appears. Press ↓ to decrease sensitivity; press ↑ to increase sensitivity. When it's set at the desired level, press EXIT. (When you reach the maximum or minimum limit, a tone sounds.)
The Split Frequency Sonar Chart page allows you to adjust
sensitivity separately for each window.
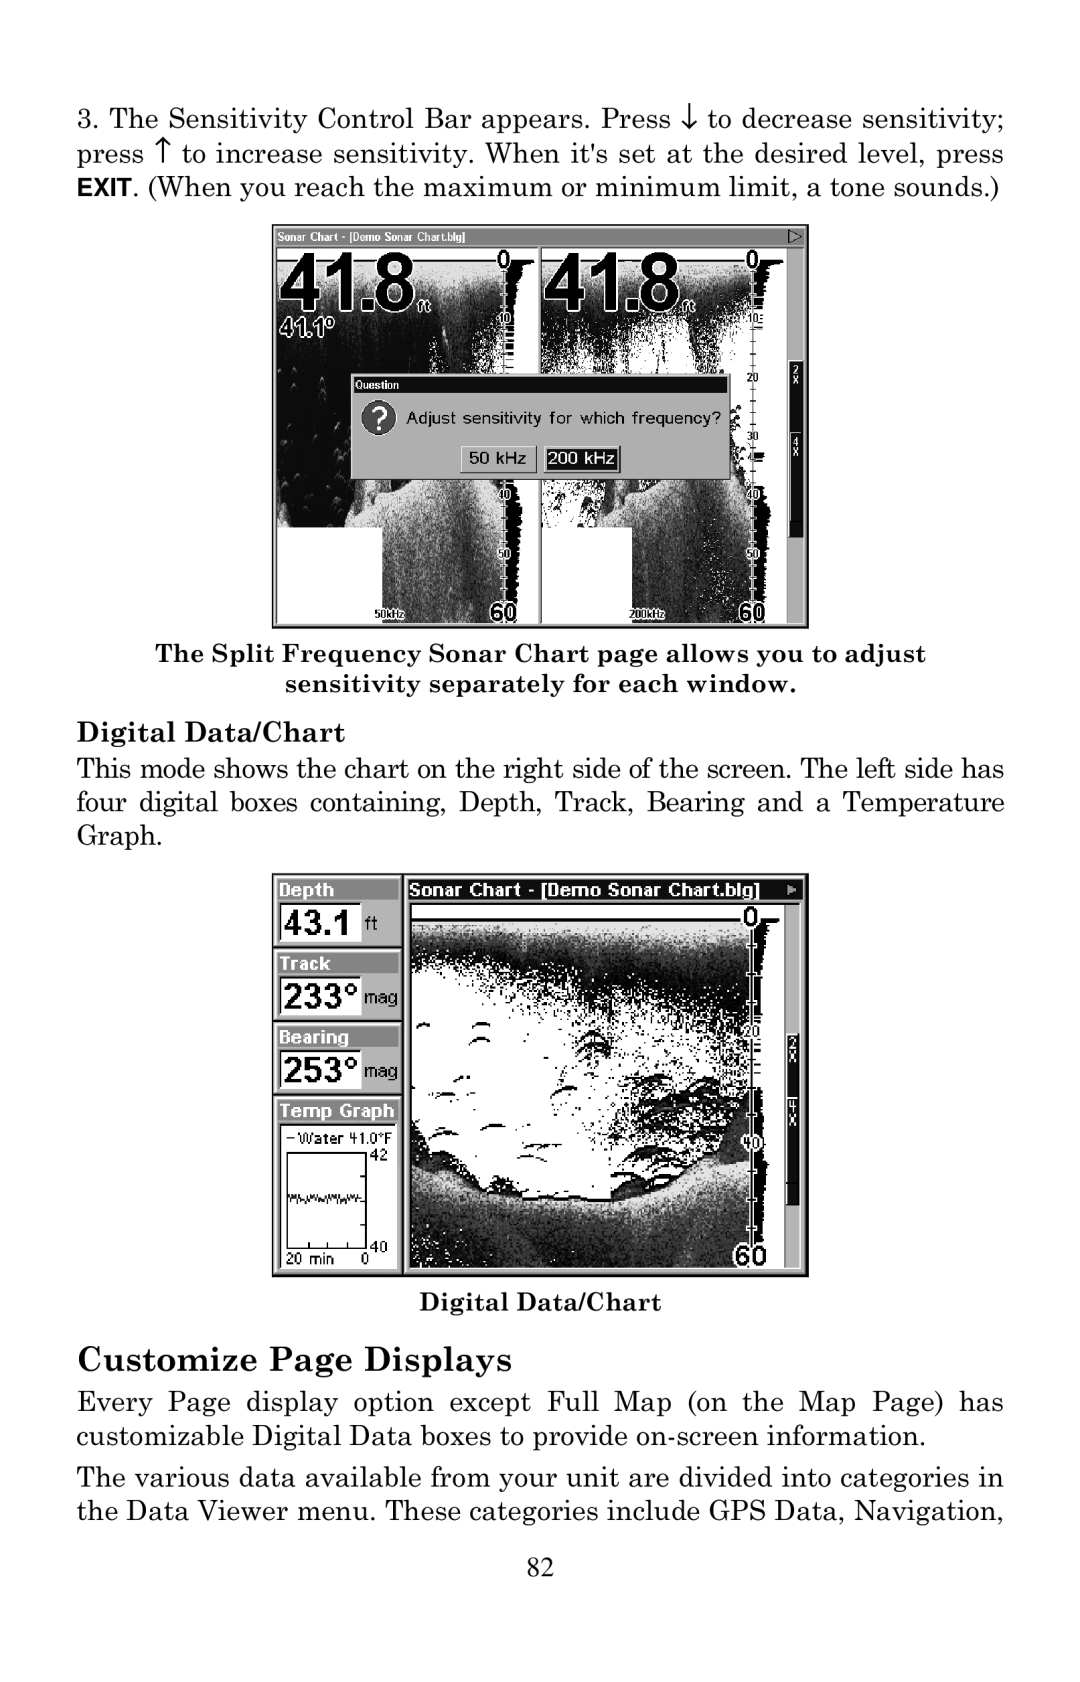
Digital Data/Chart
This mode shows the chart on the right side of the screen. The left side has four digital boxes containing, Depth, Track, Bearing and a Temperature Graph.
Digital Data/Chart
Customize Page Displays
Every Page display option except Full Map (on the Map Page) has customizable Digital Data boxes to provide
The various data available from your unit are divided into categories in the Data Viewer menu. These categories include GPS Data, Navigation,
82