actual speed, you will enter – 10 in the calibration window. If the sensor is reading 5 percent slower than true speed, you will enter + 5 in the window.
A good way to gauge your speed sensor's performance is to compare its reading with the ground speed measured by your unit's GPS functions. When you make a run to compare GPS ground speed to speed sensor speed, perform your test in relatively calm water free of current, if possible. (Unless, of course, you are taking the current speed into consideration when making your calculation.) After you have a correction figure, here's how to enter it:
1.Press MENUMENU↓ to SONAR SETUPENT↓ to CALIBRATE WATER
SPEEDENT.
2.Enter the number you calculated earlier: press ↑ or ↓ to change the first character (+ or
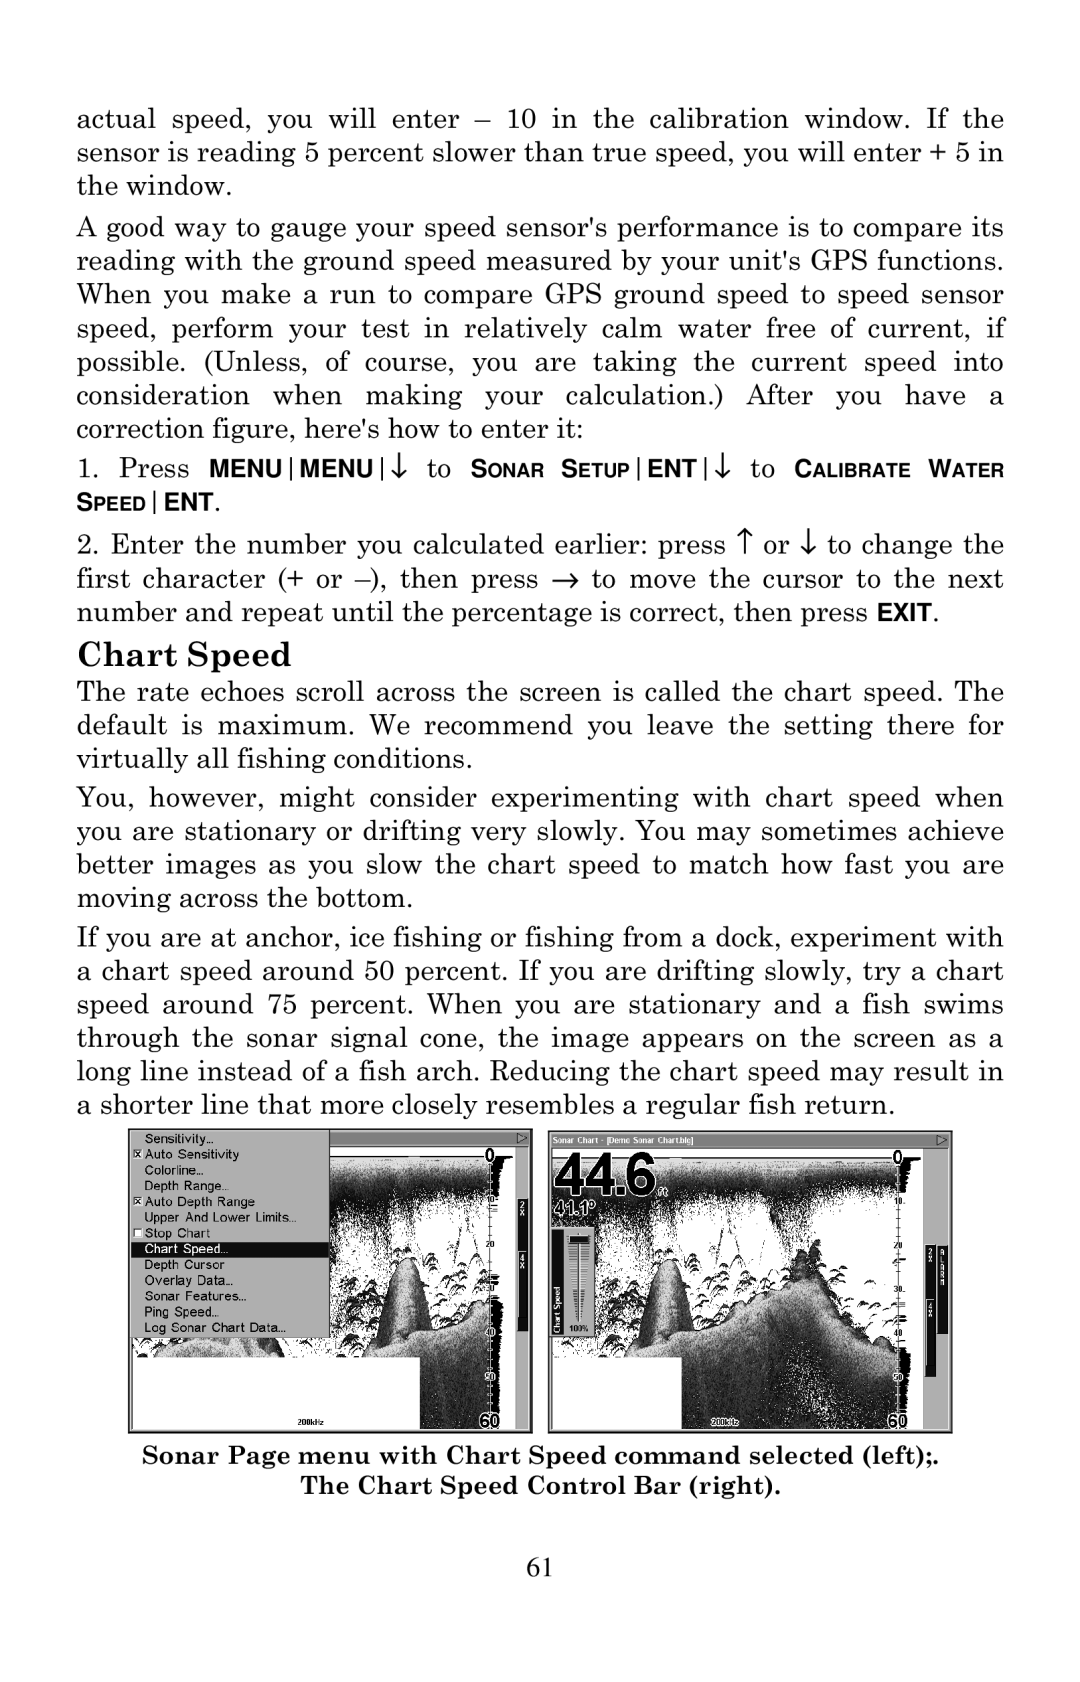
Chart Speed
The rate echoes scroll across the screen is called the chart speed. The default is maximum. We recommend you leave the setting there for virtually all fishing conditions.
You, however, might consider experimenting with chart speed when you are stationary or drifting very slowly. You may sometimes achieve better images as you slow the chart speed to match how fast you are moving across the bottom.
If you are at anchor, ice fishing or fishing from a dock, experiment with a chart speed around 50 percent. If you are drifting slowly, try a chart speed around 75 percent. When you are stationary and a fish swims through the sonar signal cone, the image appears on the screen as a long line instead of a fish arch. Reducing the chart speed may result in a shorter line that more closely resembles a regular fish return.
Sonar Page menu with Chart Speed command selected (left);.
The Chart Speed Control Bar (right).
61