Chapter 3 Device Manager basics 49
Viewing statistics as graphs
To create a graph for an object:
1Select the object or objects to be graphed (see “Selecting objects” on page 37).
2Do one of the following:
•On the toolbar, click Graph Selected.
•From the shortcut menu for the object, choose Graph.
•From the main menu, choose Graph > Chassis or Graph > Port.
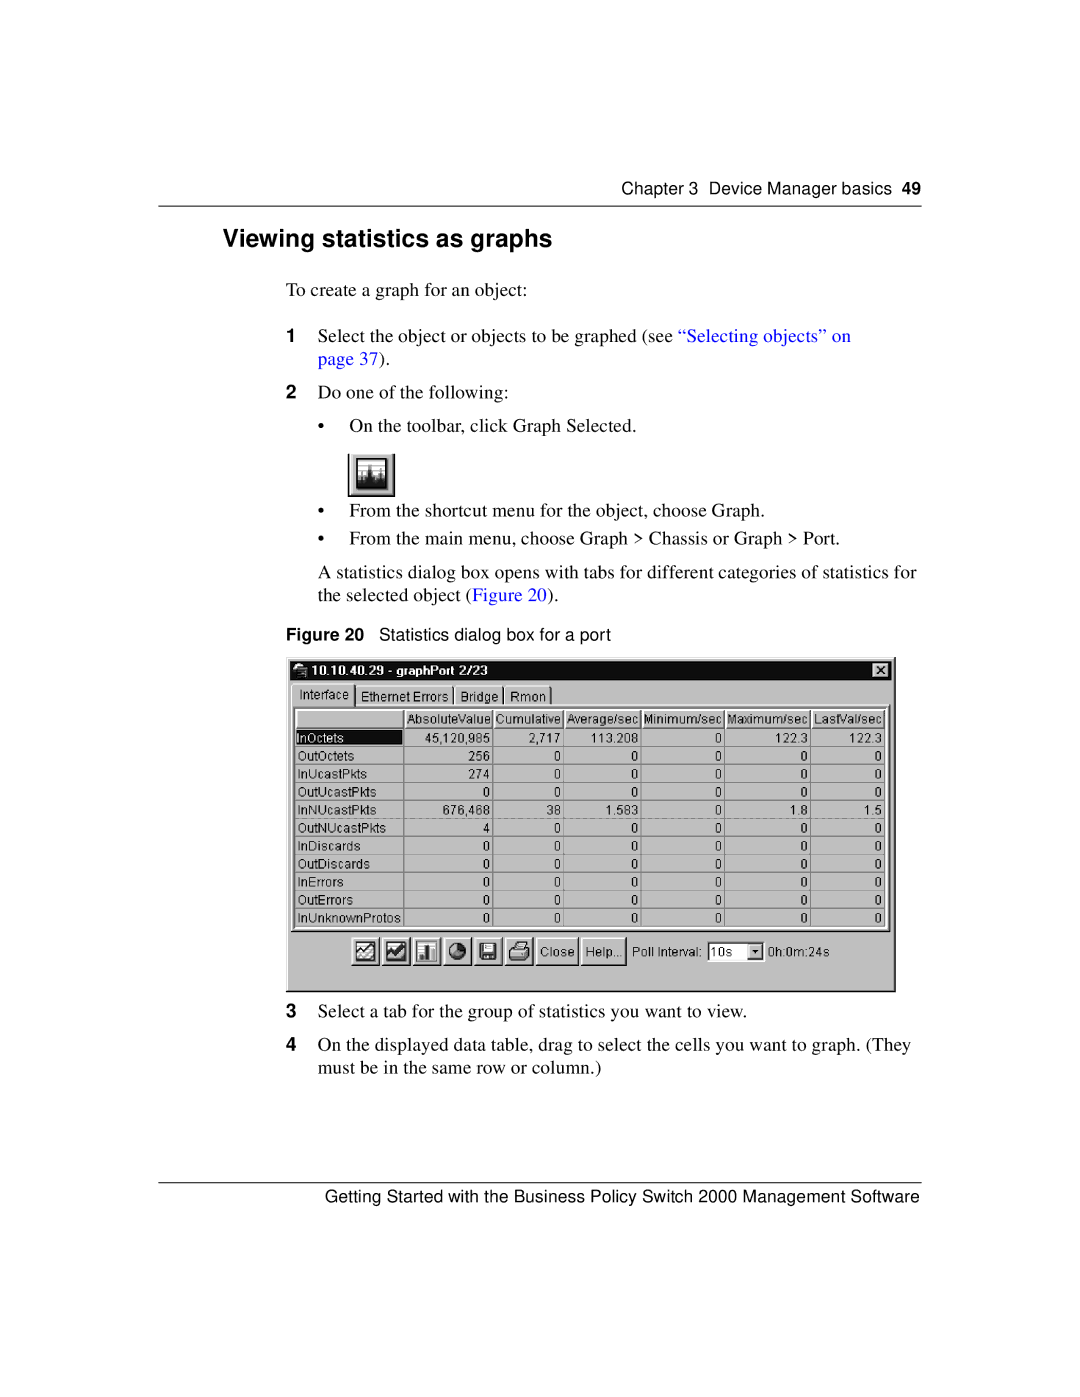
A statistics dialog box opens with tabs for different categories of statistics for the selected object (Figure 20).
Figure 20 Statistics dialog box for a port
3Select a tab for the group of statistics you want to view.
4On the displayed data table, drag to select the cells you want to graph. (They must be in the same row or column.)
Getting Started with the Business Policy Switch 2000 Management Software