Appendix
11.4 Signal Reduction (FR Models)
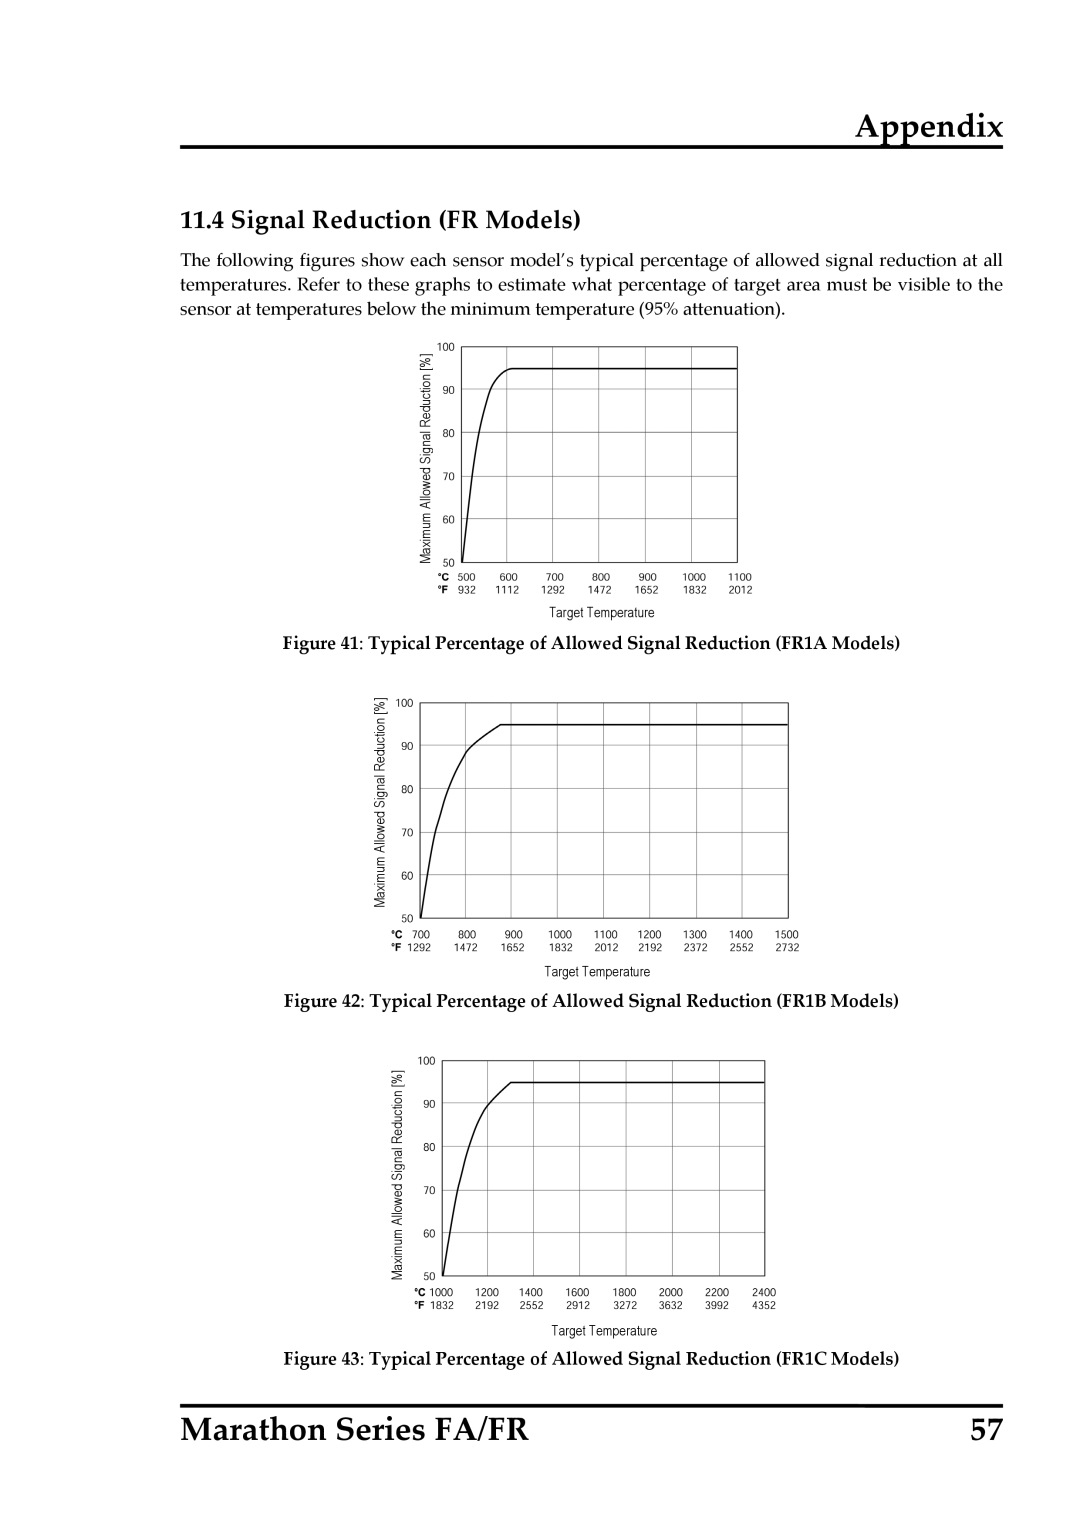
The following figures show each sensor model’s typical percentage of allowed signal reduction at all temperatures. Refer to these graphs to estimate what percentage of target area must be visible to the sensor at temperatures below the minimum temperature (95% attenuation).
Maximum Allowed Signal Reduction [%]
Target Temperature
Figure 41: Typical Percentage of Allowed Signal Reduction (FR1A Models)
Maximum Allowed Signal Reduction [%]
Target Temperature
Figure 42: Typical Percentage of Allowed Signal Reduction (FR1B Models)
Maximum Allowed Signal Reduction [%]
Target Temperature
Figure 43: Typical Percentage of Allowed Signal Reduction (FR1C Models)
Marathon Series FA/FR | 57 |