Chapter 9
Viewing DSCP Statistics
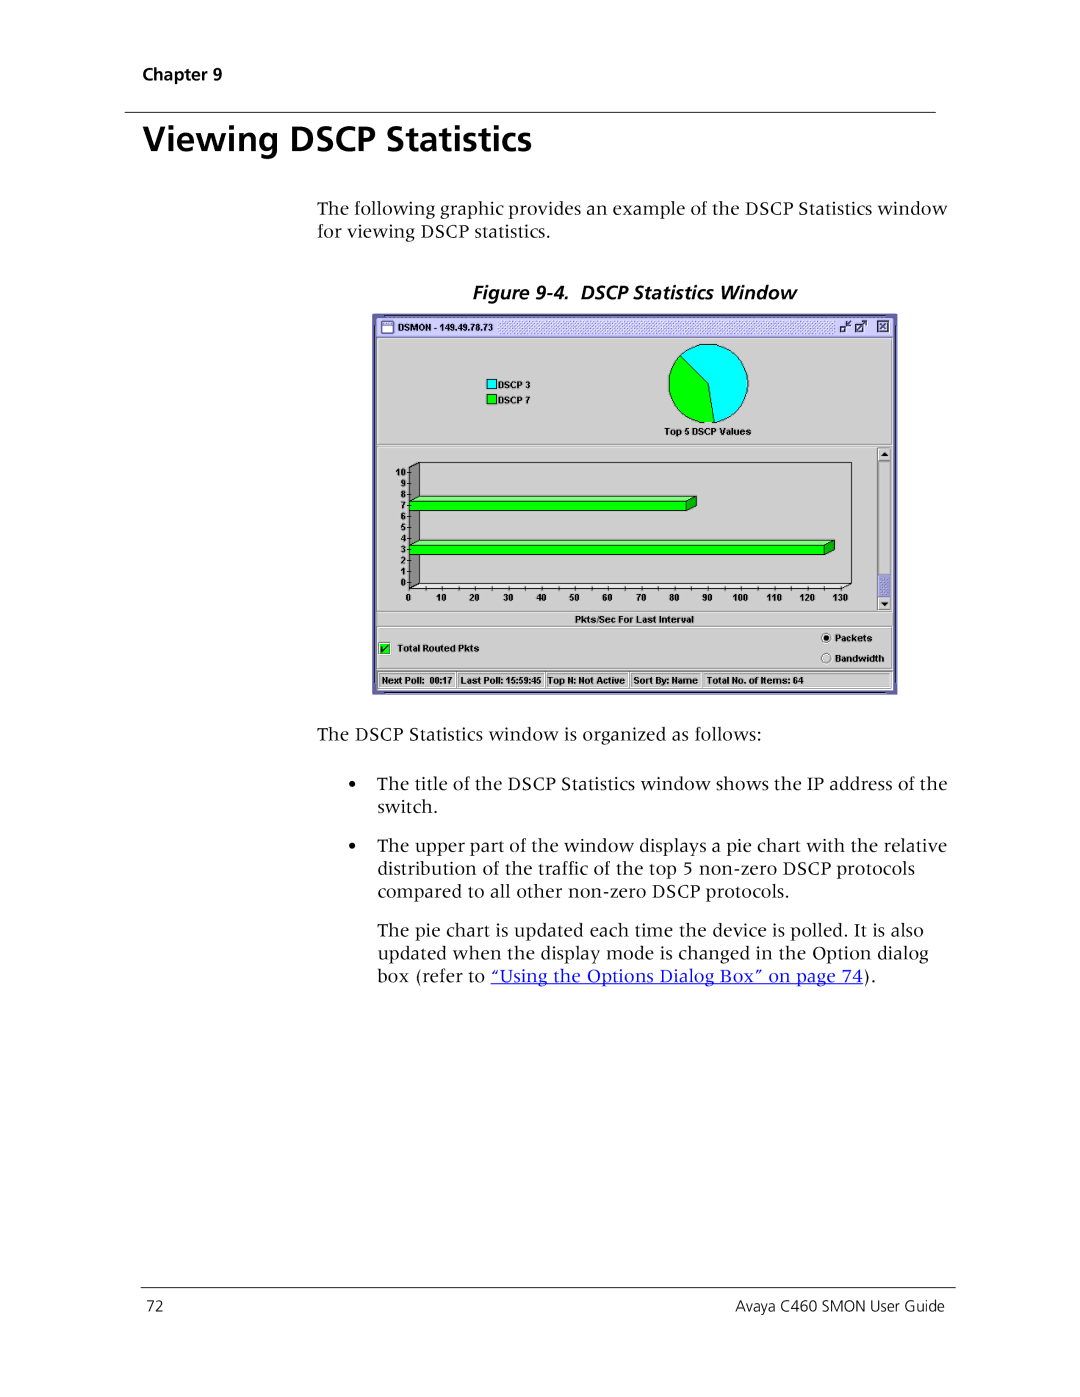
The following graphic provides an example of the DSCP Statistics window for viewing DSCP statistics.
Figure 9-4. DSCP Statistics Window
The DSCP Statistics window is organized as follows:
•The title of the DSCP Statistics window shows the IP address of the switch.
•The upper part of the window displays a pie chart with the relative distribution of the traffic of the top 5
The pie chart is updated each time the device is polled. It is also updated when the display mode is changed in the Option dialog box (refer to “Using the Options Dialog Box” on page 74).
72 | Avaya C460 SMON User Guide |
