Configuration
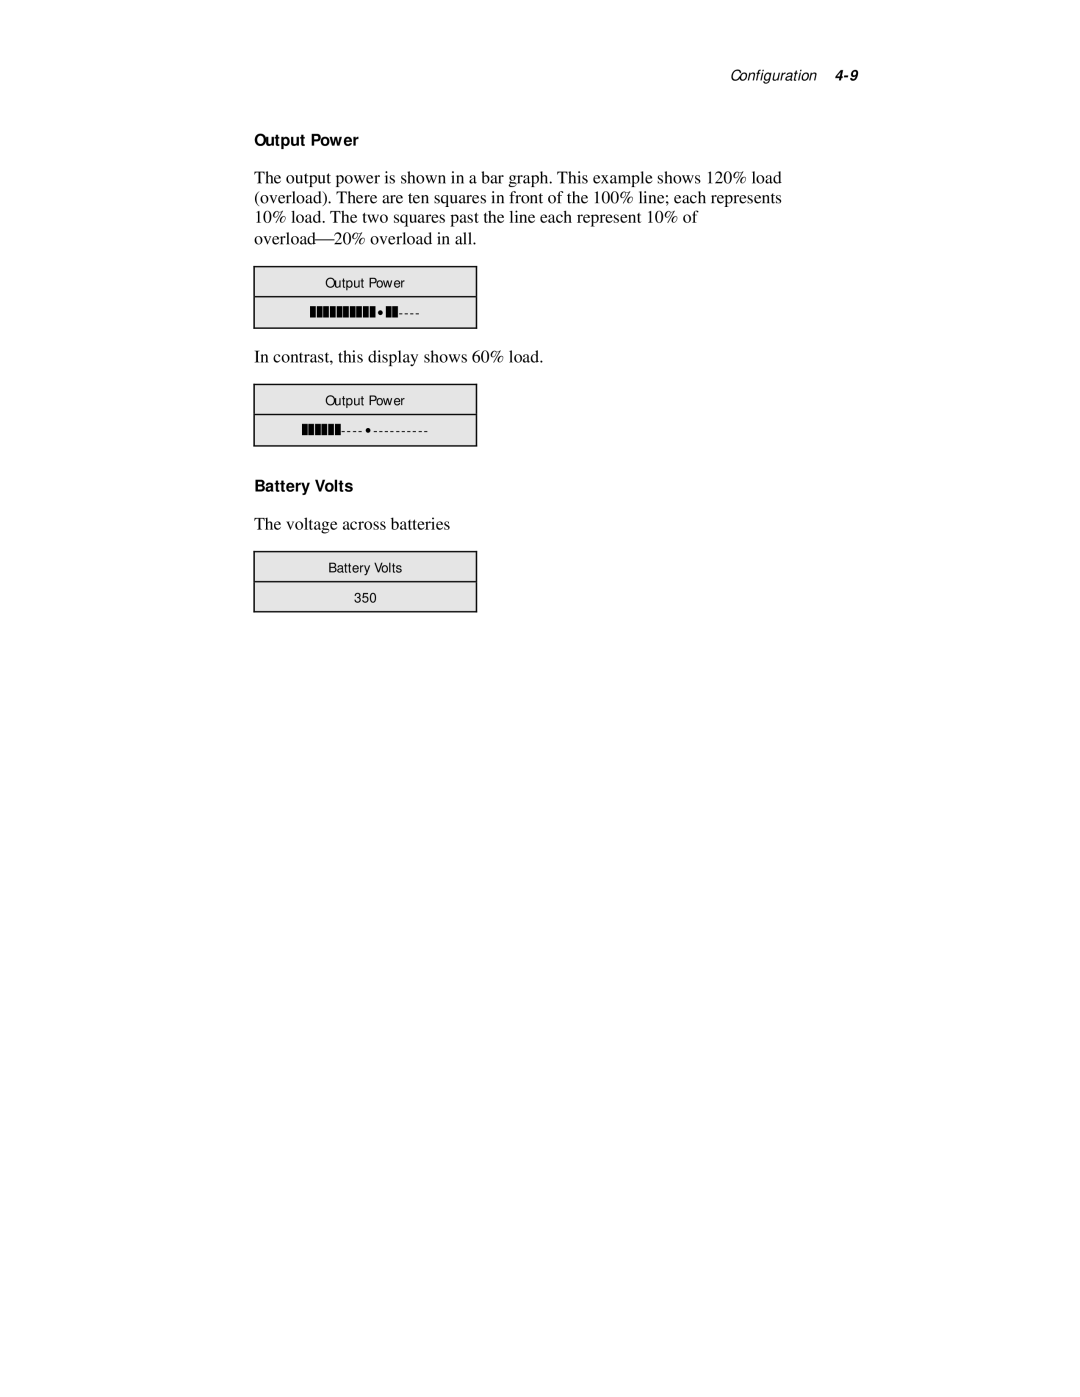
Output Power
The output power is shown in a bar graph. This example shows 120% load (overload). There are ten squares in front of the 100% line; each represents 10% load. The two squares past the line each represent 10% of overload⎯20% overload in all.
Output Power
In contrast, this display shows 60% load.
Output Power
Battery Volts
The voltage across batteries
Battery Volts
350