Model 3081FG

Instruction Manual

IB-106-3081 Rev. 1.5 September 2002

O2 CONCENTRATION

%

%

LOW CALIBRATION

CHECK GAS O2 VALUE

26020056

Figure 3-29. ACCEPT LOW O2
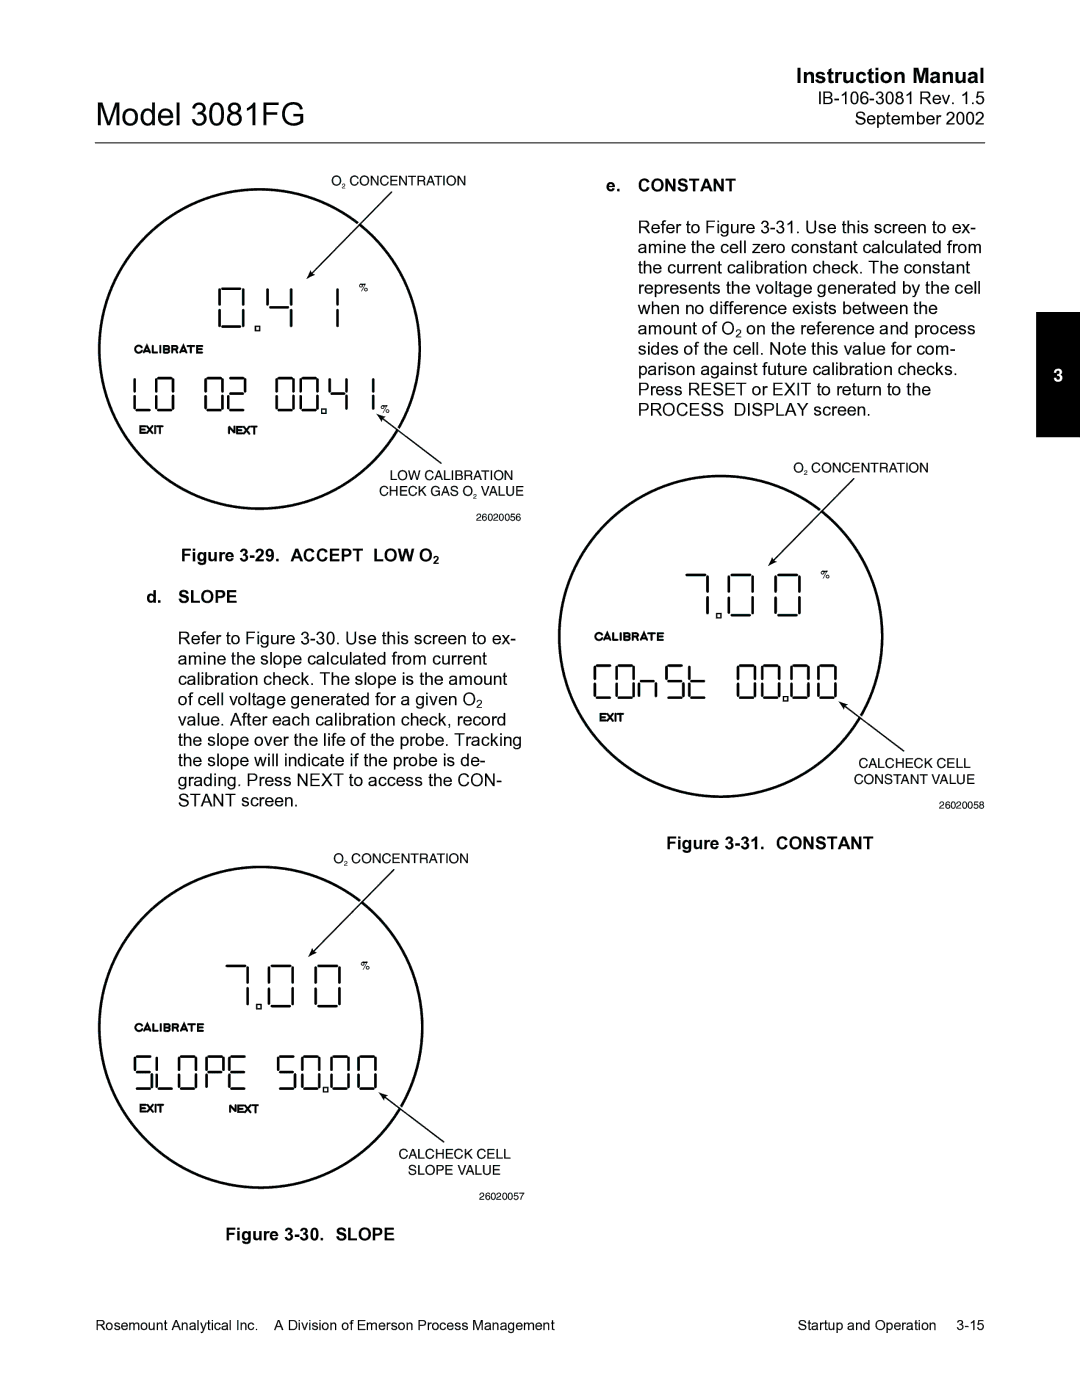
d.SLOPE

Refer to Figure 3-30. Use this screen to ex- amine the slope calculated from current calibration check. The slope is the amount of cell voltage generated for a given O2 value. After each calibration check, record the slope over the life of the probe. Tracking the slope will indicate if the probe is de- grading. Press NEXT to access the CON- STANT screen.

O2 CONCENTRATION

%

CALCHECK CELL

SLOPE VALUE

26020057

Figure 3-30. SLOPE

e.CONSTANT

Refer to Figure 3-31. Use this screen to ex- amine the cell zero constant calculated from the current calibration check. The constant represents the voltage generated by the cell when no difference exists between the amount of O2 on the reference and process

sides of the cell. Note this value for com-

parison against future calibration checks.3 Press RESET or EXIT to return to the

PROCESS DISPLAY screen.

O2 CONCENTRATION

%

CALCHECK CELL

CONSTANT VALUE

26020058

Figure 3-31. CONSTANT

Rosemount Analytical Inc. A Division of Emerson Process Management

Startup and Operation 3-15

Page 45
Image 45
Emerson 3081FG instruction manual Accept LOW O2 Slope