EXCEL 10 W7761A INPUT/OUTPUT DEVICE
Table
Table
°F (°C) | Resistance Ohms | |
|
| |
30 | 1956.79 | |
|
|
|
35 | (1.7) | 1935.79 |
|
|
|
40 | (4.4) | 1914.79 |
|
|
|
45 | (7.2) | 1893.79 |
|
| |
50 (10) | 1872.79 | |
|
| |
55 (12.8) | 1851.79 | |
|
| |
60 (15.6) | 1830.79 | |
|
| |
65 (18.3) | 1809.79 | |
|
| |
70 (21.1) | 1788.79 | |
|
| |
75 (23.9) | 1767.79 | |
|
| |
80 (26.7) | 1746.79 | |
|
| |
85 (29.4) | 1725.79 | |
|
| |
90 (32.2) | 1704.78 | |
|
| |
95 (35) | 1683.78 | |
|
|
|
100 | (37.8) | 1662.78 |
|
|
|
105 | (40.6) | 1641.78 |
|
|
|
110 | (43.3) | 1620.78 |
|
|
|
115 | (46.1) | 1599.78 |
|
|
|
120 | (48.9) | 1578.78 |
|
|
|
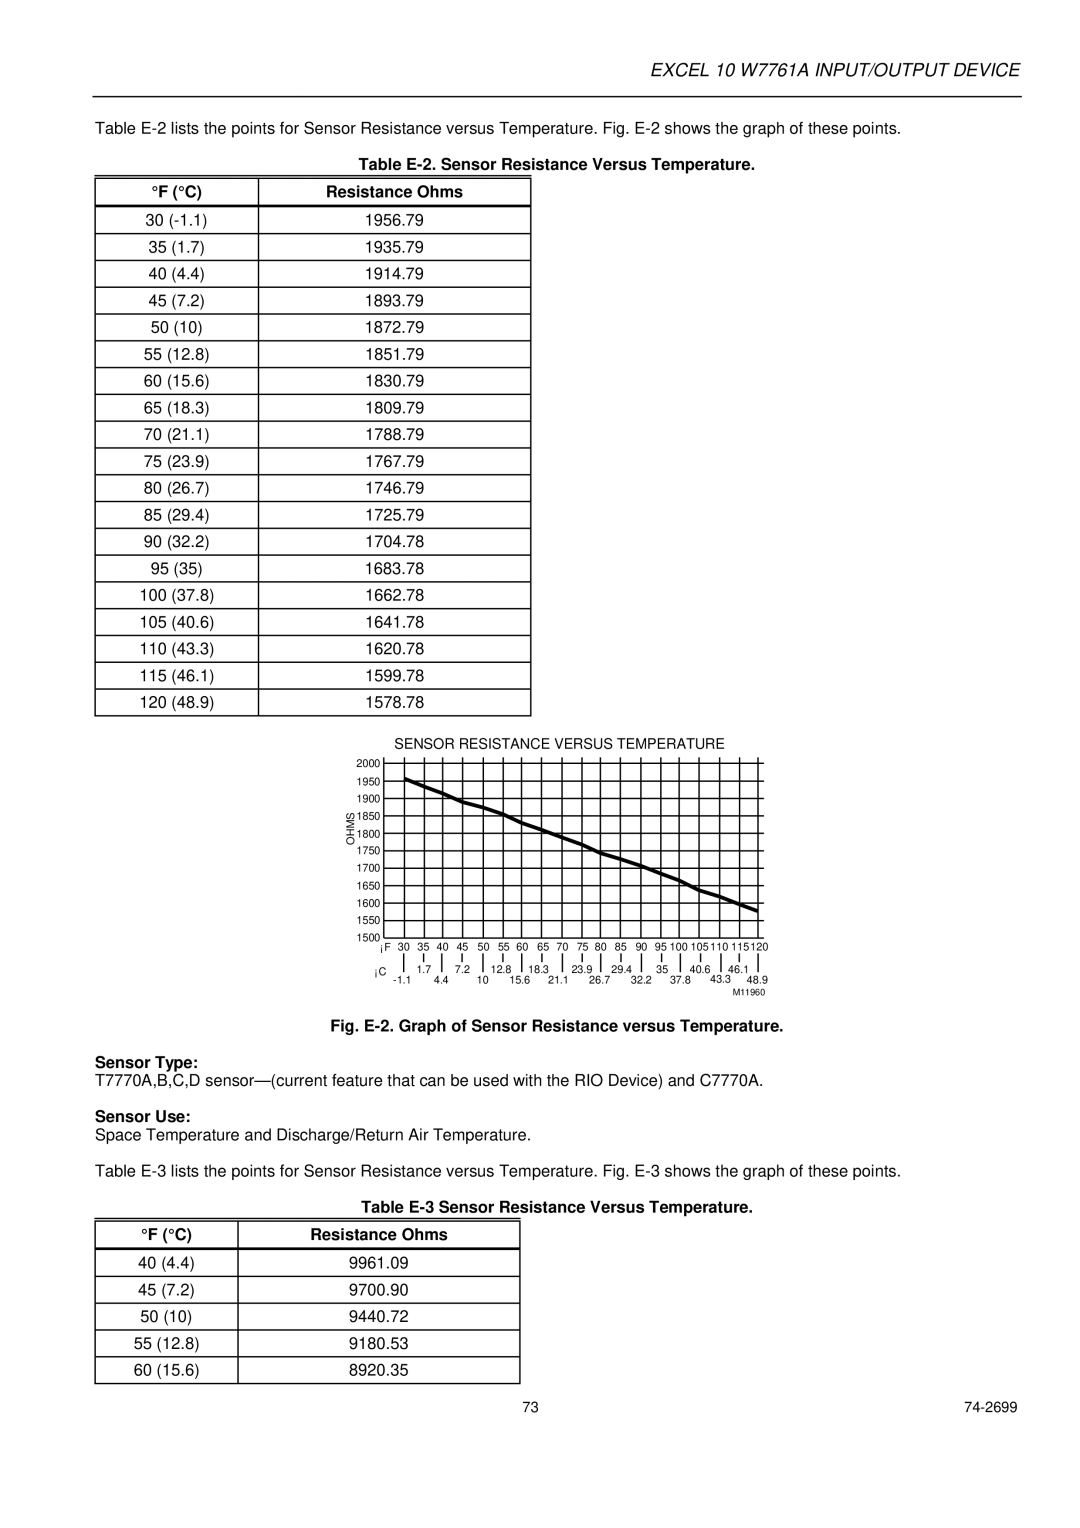
SENSOR RESISTANCE VERSUS TEMPERATURE
| 2000 |
|
|
|
|
|
|
|
|
|
|
|
|
|
|
| 1950 |
|
|
|
|
|
|
|
|
|
|
|
|
|
|
| 1900 |
|
|
|
|
|
|
|
|
|
|
|
|
|
|
OHMS | 1850 |
|
|
|
|
|
|
|
|
|
|
|
|
|
|
1800 |
|
|
|
|
|
|
|
|
|
|
|
|
|
| |
1750 |
|
|
|
|
|
|
|
|
|
|
|
|
|
| |
|
|
|
|
|
|
|
|
|
|
|
|
|
|
| |
| 1700 |
|
|
|
|
|
|
|
|
|
|
|
|
|
|
| 1650 |
|
|
|
|
|
|
|
|
|
|
|
|
|
|
| 1600 |
|
|
|
|
|
|
|
|
|
|
|
|
|
|
| 1550 |
|
|
|
|
|
|
|
|
|
|
|
|
|
|
| 1500°F 30 35 40 45 | 50 55 60 |
| 65 70 | 75 80 | 85 | 90 | 95 100 105 110 115 120 | |||||||
| ° | 1.7 | 7.2 |
| 12.8 | 18.3 | 23.9 | 29.4 |
| 35 | 40.6 | 46.1 | |||
| C |
| 4.4 | 10 | 15.6 | 21.1 | 26.7 | 32.2 |
| 37.8 | 43.3 | 48.9 | |||
|
|
| |||||||||||||
|
|
|
|
|
|
|
|
|
|
|
|
|
|
| M11960 |
Fig. E-2. Graph of Sensor Resistance versus Temperature.
Sensor Type:
T7770A,B,C,D
Sensor Use:
Space Temperature and Discharge/Return Air Temperature.
Table
Table
°F (°C) | Resistance Ohms |
|
|
40 (4.4) | 9961.09 |
|
|
45 (7.2) | 9700.90 |
|
|
50 (10) | 9440.72 |
|
|
55 (12.8) | 9180.53 |
|
|
60 (15.6) | 8920.35 |
|
|
73 |