3-Administering the MaxNAS R8
1. System Information
1.1 System Information
This page is the first page you see when you enter the MaxNAS R8 web interface. On this page you will see basic information about the RAID subsystem including the firmware version and the current uptime.
1.2 System and Services Status
This page displays information about the current status of the MaxNAS R8 including CPU load, Fan Speed and the current status of each supported network service.
1.3 System Logs
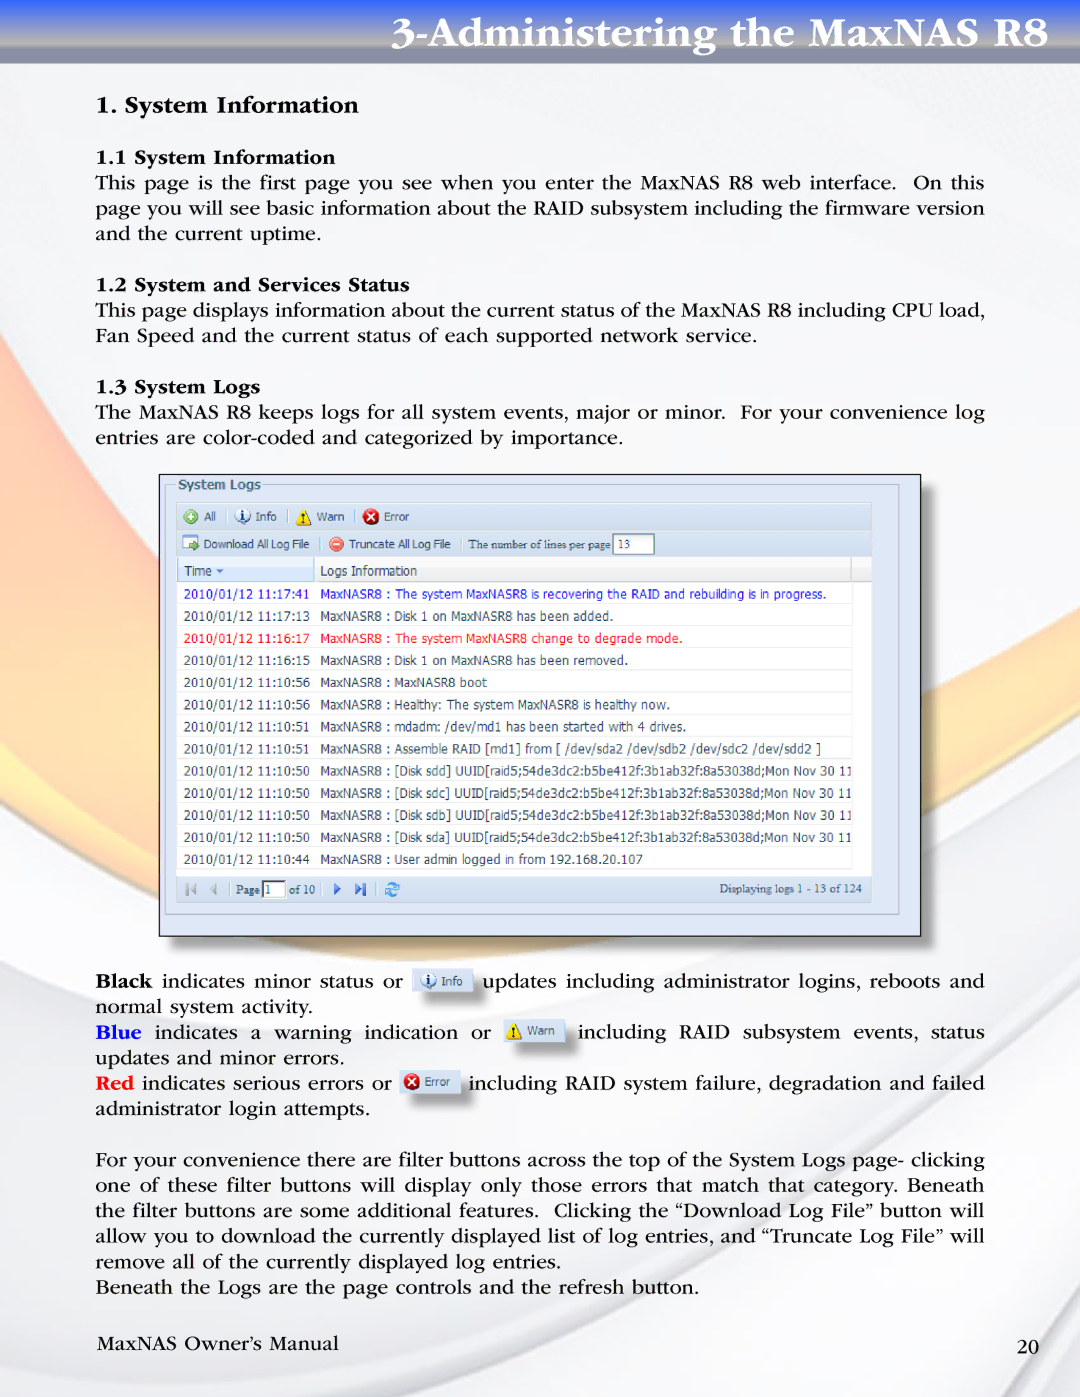
The MaxNAS R8 keeps logs for all system events, major or minor. For your convenience log entries are
Black indicates minor status or |
|
|
| updates including administrator logins, reboots and | |||
|
|
| |||||
normal system activity. |
|
|
|
|
|
| |
Blue indicates a warning indication | or |
|
| including RAID subsystem events, status | |||
|
| ||||||
updates and minor errors. |
|
|
|
|
| ||
Red indicates serious errors or |
|
| including RAID system failure, degradation and failed | ||||
|
| ||||||
administrator login attempts. |
|
|
|
|
|
| |
For your convenience there are filter buttons across the top of the System Logs page- clicking one of these filter buttons will display only those errors that match that category. Beneath the filter buttons are some additional features. Clicking the “Download Log File” button will allow you to download the currently displayed list of log entries, and “Truncate Log File” will remove all of the currently displayed log entries.
Beneath the Logs are the page controls and the refresh button.
MaxNAS Owner’s Manual | 20 |
