9-5 Sonar A-Scope display
A
BE
D
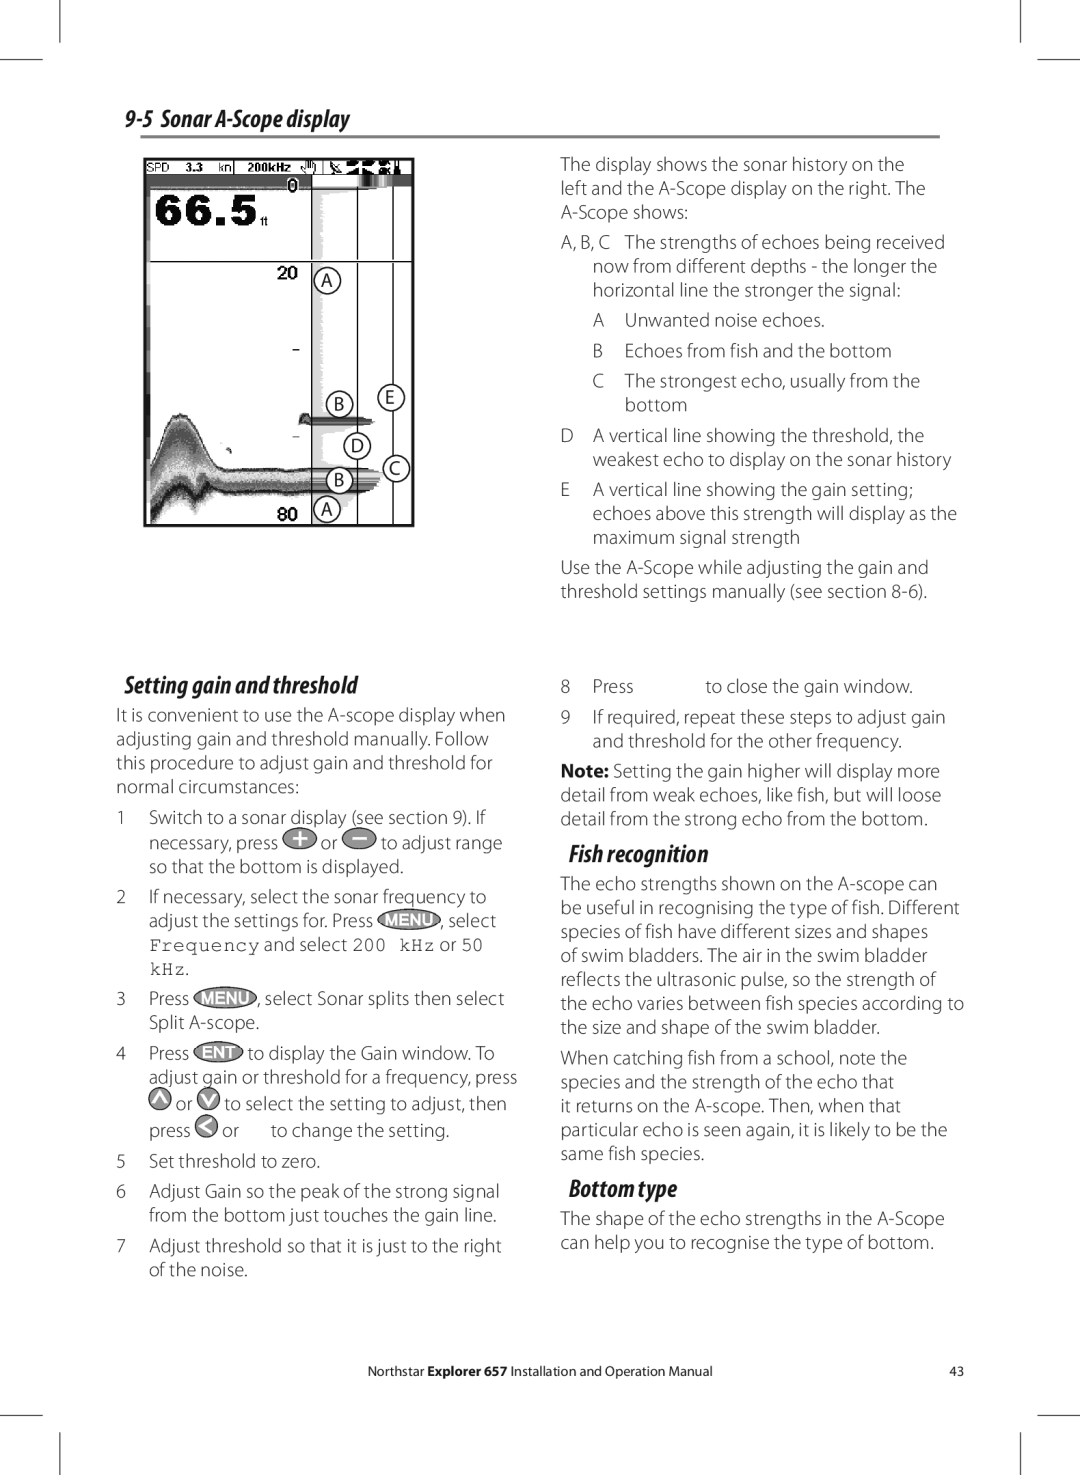
The display shows the sonar history on the left and the
A, B, C The strengths of echoes being received now from different depths - the longer the horizontal line the stronger the signal:
AUnwanted noise echoes.
BEchoes from fish and the bottom
CThe strongest echo, usually from the bottom
D A vertical line showing the threshold, the |
weakest echo to display on the sonar history |
B
A
C
EA vertical line showing the gain setting; echoes above this strength will display as the maximum signal strength
Use the
Setting gain and threshold
It is convenient to use the
1Switch to a sonar display (see section 9). If
necessary, press ![]() or
or ![]() to adjust range so that the bottom is displayed.
to adjust range so that the bottom is displayed.
2If necessary, select the sonar frequency to
adjust the settings for. Press ![]() , select
, select
Frequency and select 200 kHz or 50 kHz.
3Press ![]() , select Sonar splits then select Split
, select Sonar splits then select Split
4Press ![]() to display the Gain window. To
to display the Gain window. To
adjust gain or threshold for a frequency, press ![]() or
or ![]() to select the setting to adjust, then press
to select the setting to adjust, then press ![]() or
or ![]() to change the setting.
to change the setting.
5Set threshold to zero.
6Adjust Gain so the peak of the strong signal from the bottom just touches the gain line.
7Adjust threshold so that it is just to the right of the noise.
8Press ![]() to close the gain window.
to close the gain window.
9If required, repeat these steps to adjust gain and threshold for the other frequency.
Note: Setting the gain higher will display more detail from weak echoes, like fish, but will loose detail from the strong echo from the bottom.
Fish recognition
The echo strengths shown on the
When catching fish from a school, note the species and the strength of the echo that it returns on the
Bottom type
The shape of the echo strengths in the
Northstar Explorer 657 Installation and Operation Manual | 43 |
