Ricoh WG-4 GPS Ricoh WG-4
Regarding copyrights
Regarding trademarks
Using Your Camera Safely
Regarding Product Registration
To users of this camera
About the Camera
About the Power Adapter and the AC Adapter
About the Battery
Precautions for D-LI92 Battery Usage
Precautions on Carrying and Using Your Camera
Before Using Your Camera
About the Battery and Power Adapter
Care to be Taken During Handling
Cleaning Your Camera
Storing Your Camera
Other Precautions
Check the Following Before Going Near the Water
Precautions Before Using the Camera in the Water
Regarding Waterproof, Dustproof, and Shockproof Design
Contact surface
Precautions When Using the Camera in the Water
Be Careful Near the Water
Precautions After Using the Camera in the Water
Camera’s accessories are not waterproof
Contents
Taking Pictures with Automatic Exposure Adjustment
Underwater Shooting Underwater Mode/Underwater Movie Mode
Taking Pictures
125
Recording Movies 112
Settings
Setting the Printing Service Dpof 163
Editing and Printing 144
Connecting to a Computer 191
Appendix 204
Or 4 3or
Indicates precautions to be taken when operating the camera
2or
Related operation
Playing Back and Deleting Images
Connecting to a Computer
Composition of the Operating Manual
Editing and Printing
Checking the Contents of the Package
Front
Names of Parts
Getting Started
Back
Names of Operating Parts
Getting
Macro stand
Display in a Mode
Display Indications
World Time setting p.172
F3.5
250
GettingStarted
When the lens points to the north
When the lens points to the east
GPS latitude GPS status GPS longitude
Display in Q Mode
Info
Normal Display/ Info 1 in Playback Mode
A10
Eye-Fi communication status p.181
700hPa
Guide Display
180 04/04/14 06 25 35 45
Four-way controller Menu 3 button
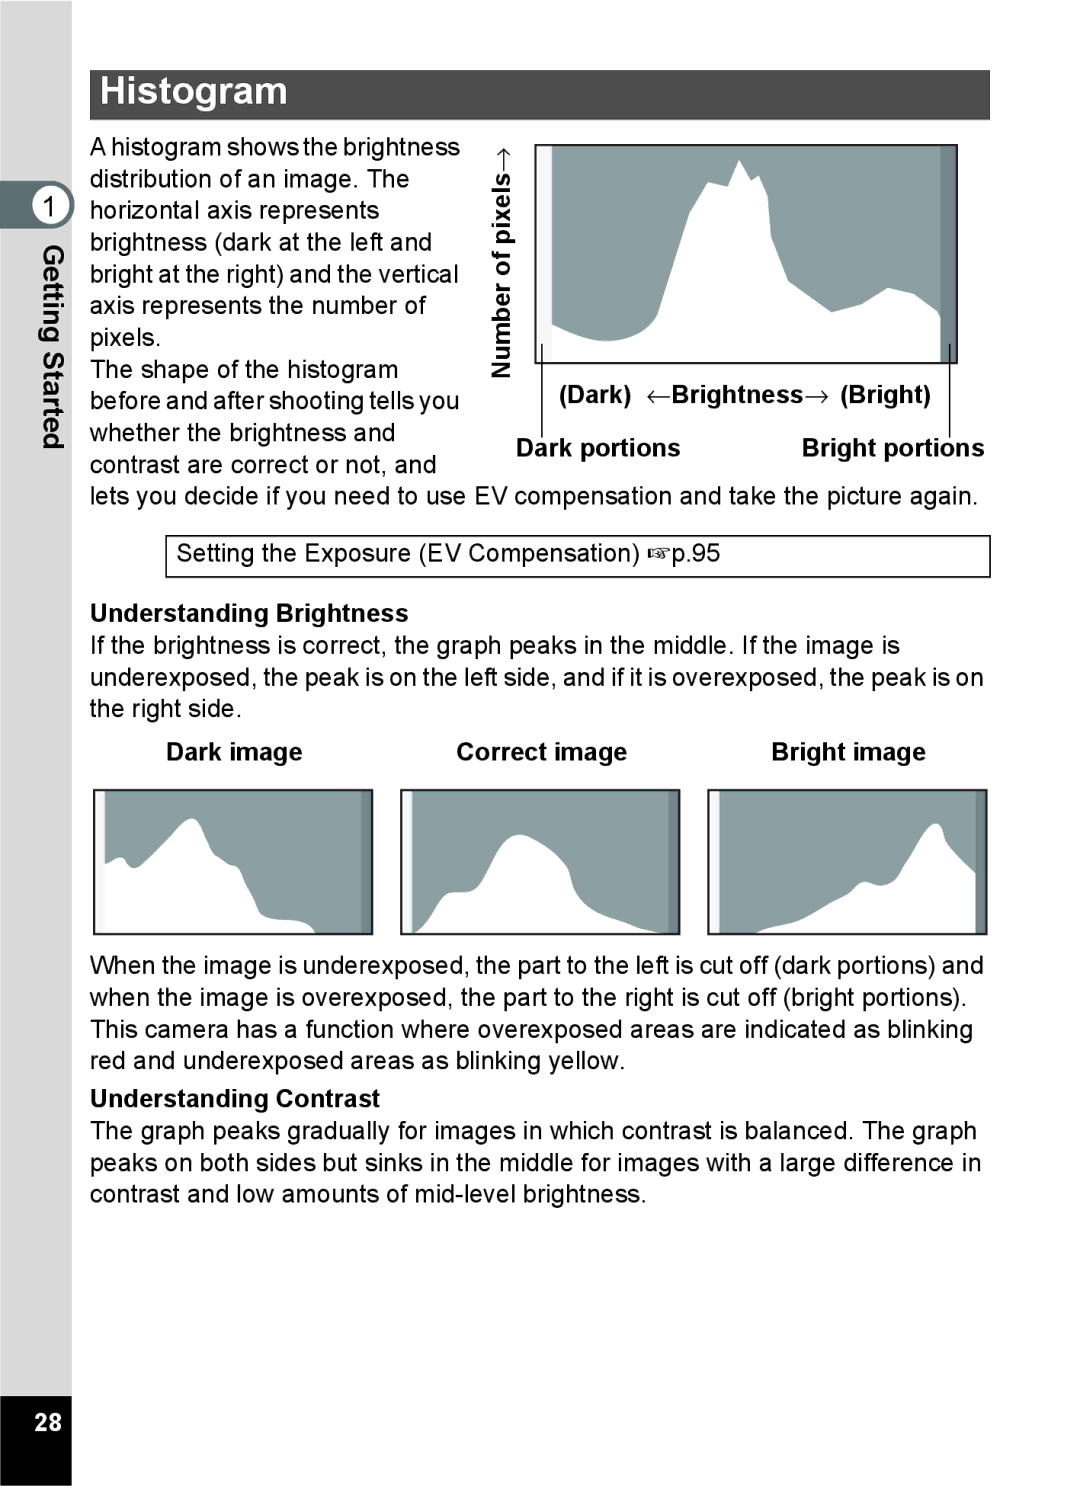
Understanding Brightness
Histogram
←Brightness→ Bright
Dark image Correct image Bright image
Electronic Level
Sub-display Indicator Ricoh WG-4 GPS Only
Protective rubber ring
Attaching the Carabiner Strap
Battery cover lock Release latch
Powering the Camera
Installing the Battery
Started
GettingStarted
Charging the Battery
Image Storage Capacity*1
Playback Time
Approx min
Camera will turn off after this message appears
Insert the DC coupler
Using the AC Adapter
Started
DC terminal DC coupler
GettingStarted
Installing an SD Memory Card
Backing Up Data
Battery cover SD Memory SD Memory Card Card socket
Turning the Camera On and Off
Press the power button
Press the power button again
Checking the SD Memory Card
Starting-up in Playback Mode
Press and hold down the Q button
Playing Back Still Pictures 1p.125
Press the 4 button
Initial Settings
Setting the Display Language
Four-way controller Button 3 button
Press the four-way controller
Started Use the four-way controller 45 to choose a city
When the Wrong Language Has Been Inadvertently Selected
When the Screen After Appears in the Wrong Language
Press the 3 button
Setting the Date and Time
Use the four-way controller 23 to change the month
Set the current date and time and the display format
GettingStarted
Understanding the Button Functions
Mode
Four-way controller
Green button
Switches to a mode p.52
Y button
Green/i button
Camera switches to a mode
Switching Between a Mode and Q Mode
Camera switches to Q mode
Displaying data stored in the built-in memory
Setting the Camera Functions
Playback mode
Operating the Menus
Menu Exit
Exits the menu and returns to the original screen
Rec. Mode Menu
Menu List
Correction
Memory
Tone Adjustment
Description
123
a Rec. Mode Menu
Common
Operations
Setting Menu
Movie Menu
C Movie Menu
Saving mode
Eye-Fi For setting whether or not to use Eye-Fi
Power Saving
When playing back images
W Setting Menu
W Setting Menu 5 *RICOH WG-4 GPS only
Taking Pictures
Check the subject and shooting information on the display
Focus frame Face detection frame
Press the shutter release button halfway
Press the shutter release button fully Taking Pictures
Press halfway
Using the Shutter Release Button
Poor focusing conditions
Press fully
Instant Review and Blink Detection
Using the Zoom
Press the W/T button in a mode
Zoom ratio
Zoom in with high image quality
Recorded pixels and the maximum zoom ratio
To Set the Digital Zoom
Press the 3 button in a mode
To switch between O On or P
Use the four-way controller
Use the four-way controller 2345 to choose a shooting mode
Setting the Shooting Mode
Press the four-way controller 3 in a mode
Capture Mode Palette appears
Auto Picture
Captures images with the settings saved as E p.73
Underwater Movie Use this mode for taking underwater movies
Sunset
Time
Description Flower
Softened
Saves them as a movie
Using the Face Detection Function
Switching the Face Detection Function 1p.99
Pictures
\Press the shutter release button halfway
Taking Pictures in Basic Mode Green Mode
Press the Green button in a mode
Press the shutter release button fully
250 F3.5
Set the shooting mode to e or b. p.67
Using E Mode
To Save the Settings in E Mode
Press the four-way controller 2 to select Save
To Take Pictures in E Mode Use the four-way controller
To select E from Capture Mode Palette
Take a picture
E mode is selected and the camera returns to capture mode
Taking Pictures of Your Pet Pet Mode
Taking Pictures in Digital Microscope Mode
Mode is selected and the camera returns to capture mode
Set the interval
Press the 4 button while the current settings are displayed
Taking Pictures at a Set Interval Interval Shot
Set the number of shots
Using the Self-timer
Set the start delay
Press the four-way controller 2 in a mode
If you select g
If you select Z
Continuous
Camera is ready for taking pictures continuously
Button on the remote control unit is pressed
Taking Pictures Using a Remote Control Unit Optional
Taking Press the four-way controller 2 in a mode
Remote control unit is pressed
Press the four-way controller 2 in a mode
Setting the Shooting Functions
Using the Rec. Mode Menu Items
Selecting the Flash Mode
Press the four-way controller 4 in a mode
Selecting the Focus Mode
About the red-eye phenomenon
Saving the Focus Mode setting 1p.123
Press the four-way controller 5 in a mode
\ indicator
Focus Mode screen appears
Changing the Autofocus Area
Use the four-way controller 23 to select Focusing Area
You can change the autofocus area Focusing Area
Press the four-way controller 5. a pull-down menu appears
Setting the Auto Macro
Setting the = Assist Light Focus Assist
AF Setting screen appears
Setting the Image Tone
Pull-down menu appears
Selecting the Number of Recorded Pixels
Selecting the Quality Level of Still Pictures
Quality Level
Use the four-way controller 23 to change the quality level
Or electric lights other than fluorescent
Adjusting the White Balance
Use the four-way controller 23 to change the setting
White Balance screen appears
Selecting the Fluorescent Light Type
Manual Setting
White balance is automatically adjusted
Have a blank sheet of white paper or similar material ready
Setting the AE Metering
Weighted
Metering Brightness and determines the exposure Center
Sensitivity is automatically set by the camera
Setting the Sensitivity
Default value sensitivity
By noise
Setting Auto ISO Range
Setting the Exposure EV Compensation
You can adjust the overall brightness of the picture
A Rec. Mode menu Press the four-way controller
Correcting the Brightness D-Range Setting
Use the four-way controller 23 to select D-Range Setting
To select Highlight Correction or
Setting the Shake Reduction
Display When Highlight Correction is set To Auto or On
Doubled
TakingPictures
Self-portrait Assist +
Switching the Face Detection Function
Subject smiles
Persons face. The camera automatically release
To Use the Self-portrait Assist Function
100
Setting is saved Blink Detection 1p.64
Setting the Blink Detection Function
Setting the Instant Review
101
Assign
Setting the Green Button Function
To select a function you want to
102
To select Fn Setting
103
Pictures
Taking
Changing Assigned Items
104
You can give an image sharp or soft outlines
Setting the Image Sharpness Sharpness
Setting the Saturation/Tone Adjustment
105
For setting the image contrast level
Setting the Image Contrast Contrast
Setting the Date Imprint Function
106
107
Setting the IQ Enhancer Processing
Setting the Macro Light
IQ Enhancer function works
Setting the Electronic Level
Using a Conversion Lens
108
109
Underwater Shooting Underwater Mode/ Underwater Movie Mode
Underwater Shooting
110
111
Recording Movies
Recording Movies
112
Saving a still picture during movie recording
113
Still picture capture with the 4 button is not available
Press the Movie button
Recording a Movie Quickly Using the Movie Button
Keeping the Shutter Release Button Pressed
Press the Movie button again
To change the number
Use the four-way controller 23 to select Recorded Pixels
C Movie menu Press the four-way controller
Recorded pixels and frame rate
Setting the Movie SR Movie Shake Reduction Function
To select O On or P Off
116
Off Optical zoom is not Available Setting is saved
Constantly Adjusting Focus While Recording Movies
Setting the Optical Zoom
117
To set the interval, then press Button
118
119
Frame moves to Start Delay
Set the total time
Frame returns to Total Time
You can capture frames for fast motion playback
Using the Time-Lapse Movie Function
Press the shutter release button fully again
120
Using the High Speed Movie Function
Camera records a high speed movie for slow motion playback
121
Using the 1cm-Macro Movie Function
Use the four-way controller 2345 to select 1cm-Macro
122
Saving the Settings Memory
123
124
To Delete the Displayed Image
Playing Back Still Pictures
Press the Qbutton after taking a picture
Button Four-way controller Button i button
Following operations can be performed during playback
Playing Back a Movie
Deleting Images
126
Image Display/12-Image Display
Press the f button in Q mode
Multi-Image Display
127
Press the f button
Playing Press the f button twice in Q mode
Folder Display/Calendar Display
Back and Deleting Images
Use the four-way controller 2345 to choose an icon
Using the Playback Functions
Q mode, press the four-way controller
Calendar display
130
Images
Back and Deleting
Selected playback function
Playback Mode Palette
131
Slideshow
Use the four-way controller 23 to select Screen Effect
133
134
Rotating the Image
Press the Q button after taking a picture
Image appears on the display
Zoom Playback
You can magnify an image up to ten times
135
PlayingBack Use the four-way controller 2 to select Delete
Deleting Images
Deleting a Single Image
Deleting Images Press the 4 button
Press the f button once or twice in Q mode
Deleting Selected Images
137
Use the four-way controller 23 to select Delete All
Press the 3 button in Q mode
Deleting All Images
Back and Deleting Images Press the four-way controller
Select Protect
Protecting Images from Deletion Protect
Use the four-way controller 2 to
139
140
USB/AV terminal Yellow White
Connecting the Camera to an AV Device
Connecting the Camera to a Video Input Terminal
141
Turn the AV device on
Turn the camera on
142
Connecting the Camera to an Hdmi Terminal
143
Printing
Editing Images
Changing the Image Size Resize
Select Recorded Pixels Quality Level
Editing and Printing Press the 4 button
Cropping Images
Choose the cropping area
145
Green frame indicates the face that is to be processed
Processing Images to Make Faces Look Smaller
146
Approx %
Using the Digital Filters
147
148
Filter from the Playback Mode Palette Press the 4 button
Using the HDR Filter
Using the Ink Rubbing Filter
You can edit the image to look like an ink rubbing
Creating a Collage Image
Use the four-way controller 45 to choose the effect
150
Item selection screen appears
Use the four-way controller To choose the recorded pixels
151
You can choose from 3 patterns of layout
To choose the image to be placed Press the 4 button
Use the four-way controller 23 to choose the background
Laying Out the Images Editing and Printing
Repeat to lay out the rest images
153
Red-eye Edit
Press the 9 button
Confirmation dialog for saving the image appears
Text Stamp
Overlaying Your Original Frame on Still Pictures
Frame
154
For details, refer to To Set Up Text Stamp p.157
Printing Set up the text stamp
Frame setting screen appears
155
Printing Press the Green button
To Adjust the Position of the Frame and Image
Press the Green button
156
To select Display Position Press the four-way controller
157
To Save a Frame from a Movie as a Still Picture
Editing Movies
To View the Preview Screen Press the Green button
158
To specify the dividing
To choose the frame
You want to save
Position
Screen for selecting a title picture appears
To Add a Title Picture to a Movie
160
Only images available for the title picture are displayed
161
Copying Images
Use the four-way controller 2 to select
Copying method selection screen appears
Copy
Use the four-way controller 23 to select Press the 4 button
To select the image you want to
162
Printing a Single Image
Printing Settings
Setting the Printing Service Dpof
Set the following items for each image
Use the four-way controller 23 to select Single Image
164
OOn The date will be imprinted
Select All Images in on p.164 Press the 4 button
Message Applies Dpof settings to all images appears
Printing All Images
165
Menu Cancel
Camera Settings
Using the Setting Menu Items
166
167
Formatting the Memory
Use the four-way controller 2 to Select Format
Format screen appears
168
Changing the Sound Settings
Use the four-way controller 23 to select the sound type
Sound screen appears
Changing the Date and Time
Use the four-way controller 23 to select Date Adjustment
W Setting menu Press the four-way controller
169
Change the time in the same way as in steps 7 to
Setting the Alarm
Alarm screen appears
170
Use the four-way controller 23 to select the alarm
Press the 4 button Press the four-way controller
171
172
Setting the World Time
Turning the Alarm Off
World Time screen appears
173
Setting is saved When X Destination is selected
Displayed in a mode
Select O if the Destination city uses daylight saving time
Use the four-way controller 23 to select the text size
Setting the Text Size on the Menu
Changing the Display Language
174
XxxRICOH xxx is the 3-digit folder number
Changing the Naming System of the Folder
175
100
Folders Press the four-way controller
Naming the Folder Yourself
Select User in in Selecting the Rule for Naming
Repeat and enter the remaining characters
You can change the naming system of the file
Changing the Naming System of the File
Press the 4 button twice
177
While is selected
Naming the File Yourself
While a is selected, or press
178
Changing the Video Output Format
179
Selecting the Hdmi Output Format
Use the four-way controller 23 to select an output format
180
Setting menu
Setting the Eye-Fi Communication
Adjusting the Brightness of the Display
Use the four-way controller 23 to select Eye-Fi
182
Using the Power Saving Function
Using the Auto Power Off Function
Choose from 2min., 1min., 30sec., 15sec., 5sec. or Off
Setting the Quick Zoom Function
Setting the Guide Display
183
184
Perform Pixel Mapping
Select Pixel Mapping.Checks the image sensor
Pixel Mapping screen appears
Changing the Start-up Screen
To choose the image for the start Up screen
185
Use the four-way controller 2 to select Reset
Resetting to Default Settings Reset
Setting the Startup Shortcut
186
Use the four-way controller 23 to select an item
Use the four-way controller 45 to switch between O On Off
Displaying the Clock Display
Press and hold down the 4 button
Press and hold down the Green button
Light up the LED Macro Lights
Automatically Rotating Images during Playing Back
188
Pressure Sensor screen appears
Using the Pressure Sensor
189
Off Displays current time only
Use the four-way controller 23 to select Camera Location
Specifying the Location where You Use the Camera
To change the setting
Press the four-way controller Use the four-way controller
MSC and PTP
Connecting to a Computer
Setting the USB Connection Mode
Computer
Connecting the Camera and a Computer
Connecting to a Computer Turn your camera on
192
193
Disconnecting the Camera from the Computer
Disconnect the USB cable from the Macintosh and your camera
Message appears
Windows
Using the Provided Software
System Requirements
Following software is included on the provided CD-ROM
Installing the Software
195
Click Finish
Click Exit on the installation screen
Select the file format to use and click Next
196
197
Click MediaImpression 2.2 LE
Click Close
Window is closed
Connect the camera to your Windows PC
Using MediaImpression on Windows
Computer Product Registration on the Internet
Click Import media files to local disk
Click Import
When the AutoPlay screen does not appear
Select an image to transfer
199
MediaImpression 2.2 LE starts and the start page appears
Using MediaImpression on Macintosh
200
Import screen appears
201
Transferring Images Using an Eye-Fi Card
202
203
Card is to be used
Mode
204
205
\ K
206
207
Messages
208
Message
209
Troubleshooting
Problem Cause Remedy
210
Same distance away as the subject
211
Lock the focus on an object
Or set the focus manually
Last Memory Setting
Default Settings
a Rec. Mode Menu Items
Reset Setting
Off Yes File No Green Button
C Movie Menu Items
213
Recorded Pixels Yes 115
W Setting Menu Items
214
Playback Mode Palette Items
215
216
Button/Key Operation
217
List of World Time Cities
218
Main Specifications
219
220
221
222
223
Ricoh WG-4
Utilities Guide for GPS Before Using the GPS
About the GPS
GPS Function on the Ricoh WG-4
Precautions for Using the GPS
CE Mark is a Directive conformity mark of the European Union
GPS screen appears
Using the GPS
Preparation for Using the GPS Function
Pull-down menu appears
Recording GPS Information on Captured Images
GPS information is being received. GPS On/Off is set to On,
Camera enters Q mode and an image appears on the display
Displaying the GPS Information Recorded on Captured Image
Recording and Saving a Log
Recording a Log at a Set Interval and Duration
Record log Starts log recording Logging Interval
Stopping Recording a Log
Saving the Recorded Log
Press the 4 button
Discarding the Recorded Log
Use the four-way controller 23 to select Discard
Confirmation screen appears
Turn the camera on
Deleting Logs
Setting of World Time is displayed
Correcting Time Automatically
Press the four-way controller 5. The GPS screen appears
Adjusting the Electronic Compass Calibration
Complete appears when the camera is successfully calibrated
Appendix
Warranty Policy
Procedure During 12-month Warranty Period
239
240
Pour les utilisateurs au Canada
For customers in USA
For customers in Canada
241
Class B Personal Computers and Peripherals
242
243
Index
244
245
246
Video output format
247
Memo
Memo
Memo
Argentia Road Mississauga, Ontario L5N 3S7
Am Kaiserkai 1, 20457 Hamburg, Germany
SL3 8PN, U.K
Road, Xu Hui District, Shanghai, 200032, China