Slope and Intercept of Quadratic Equations
A quadratic equation of y in terms of x can be expressed by the standard form y = a (x - h) 2+ k, where a is the coefficient of the second degree term (y = ax 2 + bx + c) and (h, k) is the vertex of the parabola formed by the quadratic equation. An equation where the largest exponent on the independent variable x is 2 is considered a quadratic equation. In graphing quadratic equations on the calculator, let the
Example
Graph various quadratic equations and check the relation between the graphs and the values of coefficients of the equations.
1. Graph y = x 2 and y = (x - 2) 2.
2. Graph y = x 2 and y = x 2 + 2.
3. Graph y = x 2 and y = 2x 2.
4. Graph y = x 2 and y = - 2x 2.
| Before | There may be differences in the results of calculations and graph plotting depending on the setting. | ||
Starting | Return all settings to the default value and delete all data. |
| ||
|
|
|
|
|
| Step & Key Operation | Display | Notes | |
| Enter the equation y = x 2 for Y1. | |||||||||||||||||||||
|
|
|
|
|
|
|
|
| x2 |
|
|
|
|
|
|
|
|
|
|
| ||
|
| Y= |
| X/ /T/n |
|
|
|
|
|
|
|
|
|
|
|
| ||||||
| Enter the equation y = (x - 2) 2 for | |||||||||||||||||||||
|
| Y2 using Sub feature. |
|
|
|
|
| |||||||||||||||
|
|
|
|
|
|
|
|
|
|
|
|
|
|
|
|
|
|
|
|
|
| |
|
|
|
| ALPHA |
| A |
|
| ( | X/ |
| /T/n |
|
| — |
|
| |||||
|
|
|
|
| ) | x2 | + |
|
|
|
|
|
| |||||||||
|
| ALPHA |
| H |
| ALPHA |
| K |
|
| ||||||||||||
|
|
|
|
|
| 1 |
|
|
|
| 2 |
|
|
|
| |||||||
|
| 2nd F |
| SUB |
|
|
| ENTER |
|
|
| ENTER |
| |||||||||
| ( 0 |
|
| ) |
|
|
|
|
|
|
|
|
|
|
|
|
| |||||
|
| ENTER |
|
|
|
|
|
|
|
|
|
|
|
|
| |||||||
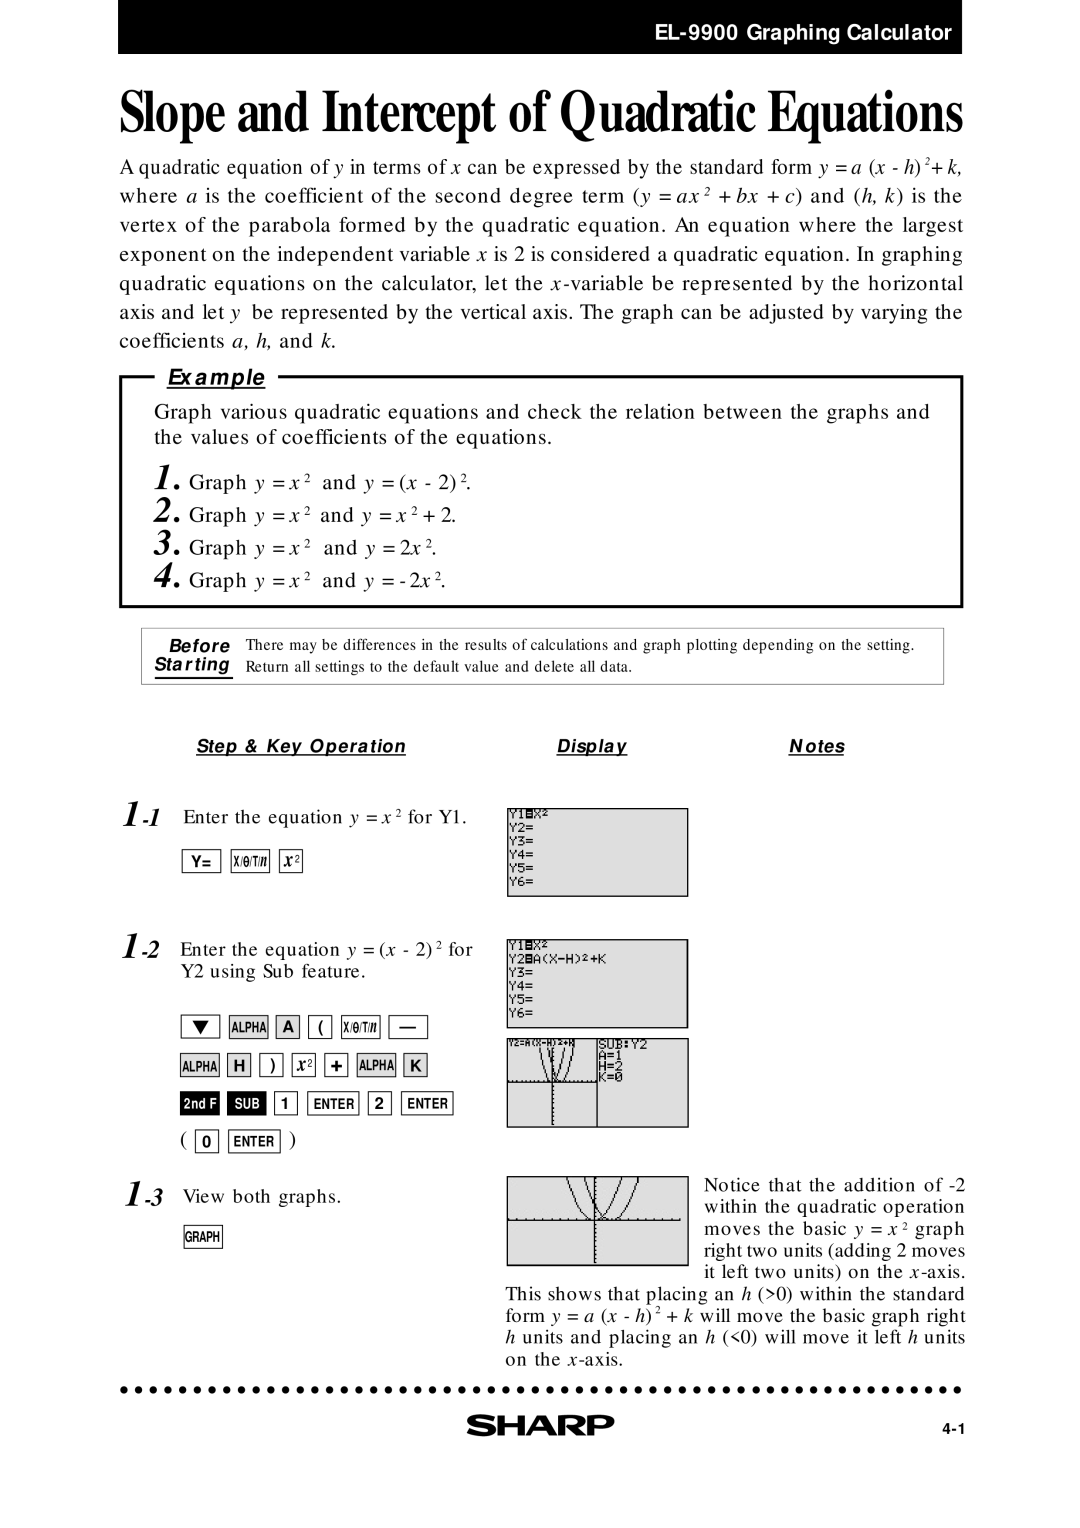
GRAPH
Notice that the addition of
This shows that placing an h (>0) within the standard form y = a (x - h) 2 + k will move the basic graph right h units and placing an h (<0) will move it left h units on the