Graphing Rational Functions
A rational function f (x) is defined as the quotient p (x) where p (x) and q (x) are two q (x)
polynomial functions such that q (x) ≠ 0. The domain of any rational function consists of all values of x such that the denominator q (x) is not zero.
A rational function consists of branches separated by vertical asymptotes, and the values of x that make the denominator q (x) = 0 but do not make the numerator p (x) = 0 are where the vertical asymptotes occur. It also has horizontal asymptotes, lines of the form y = k (k, a constant) such that the function gets arbitrarily close to, but does not cross, the horizontal asymptote when x is large.
The x intercepts of a rational function f (x), if there are any, occur at the
Example
Graph the rational function and check several points as indicated below.
1.Graph f (x) =
x
2.Find the domain of f (x), and the vertical asymptote of f (x).
3.Find the x- and
4.Estimate the horizontal asymptote of f (x).
| Before | There may be differences in the results of calculations and graph plotting depending on the setting. | ||||||||||
Starting | Return all settings to the default value and delete all data. |
|
|
| ||||||||
|
|
|
|
|
|
|
|
|
|
|
|
|
|
| Set the zoom to the decimal window: | ZOOM |
| A | ( | ENTER |
| ALPHA |
|
| ) 7 |
|
|
|
|
|
|
|
|
|
|
|
|
|
| Step & Key Operation |
| Display |
|
| Notes | ||||||
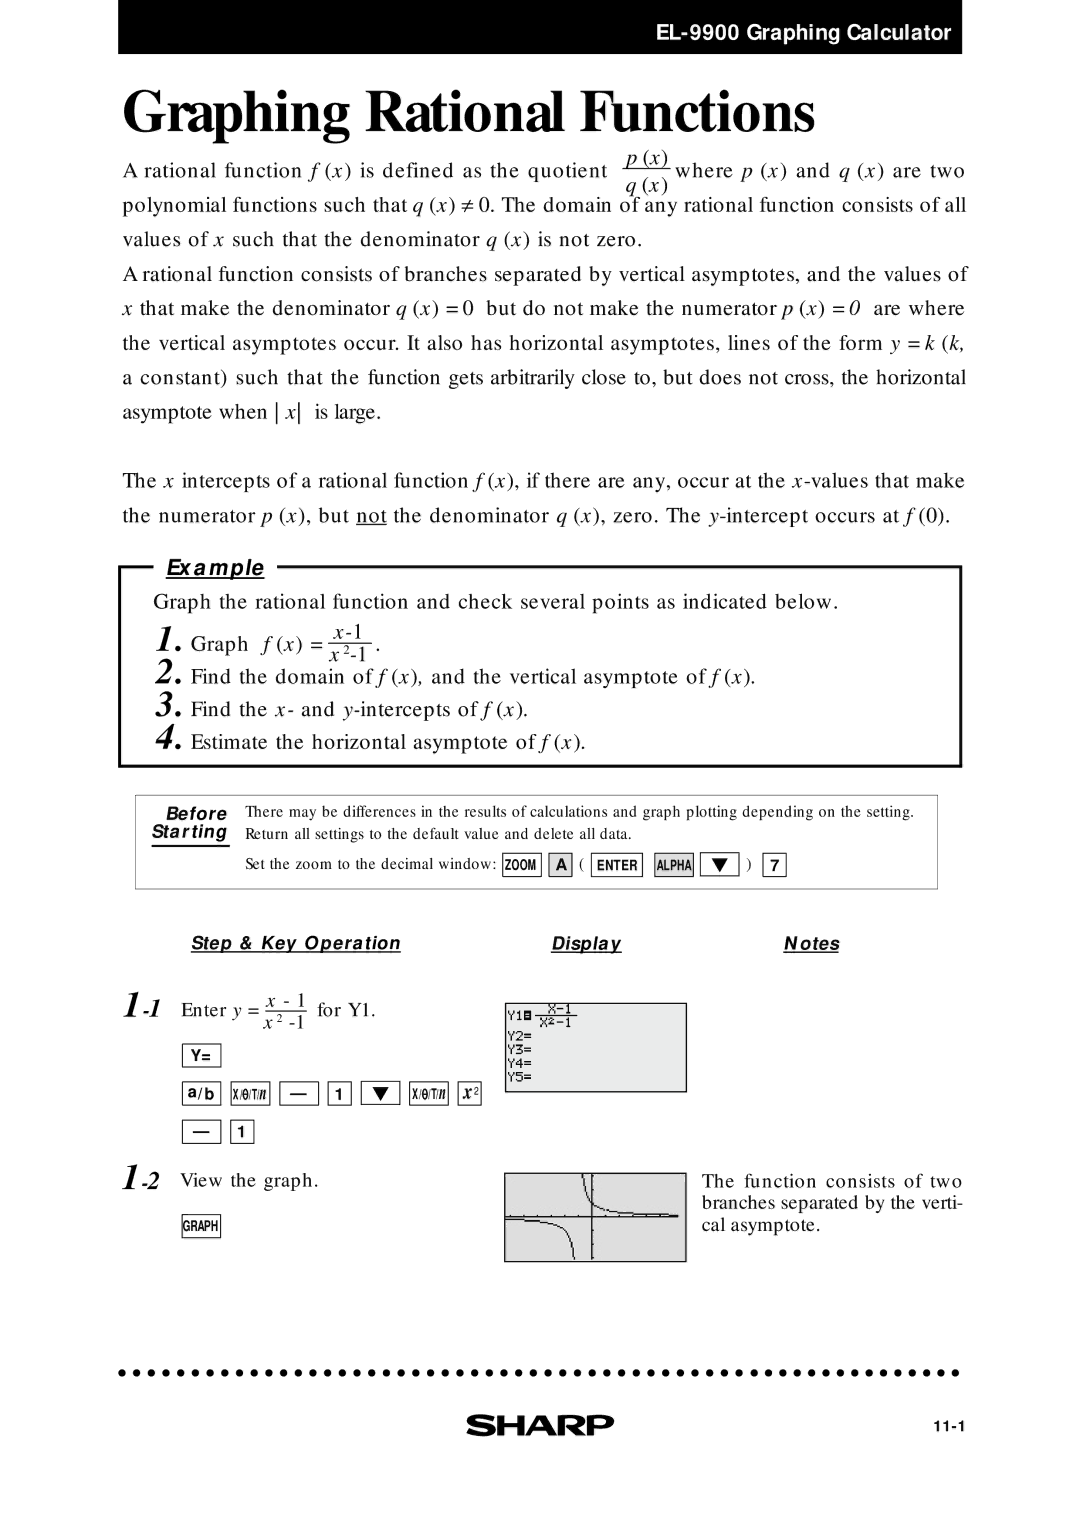
Y=
a/b ![]()
![]() X/
X/![]() /T/n
/T/n ![]()
![]() —
— ![]()
![]() 1
1
— ![]()
![]() 1
1
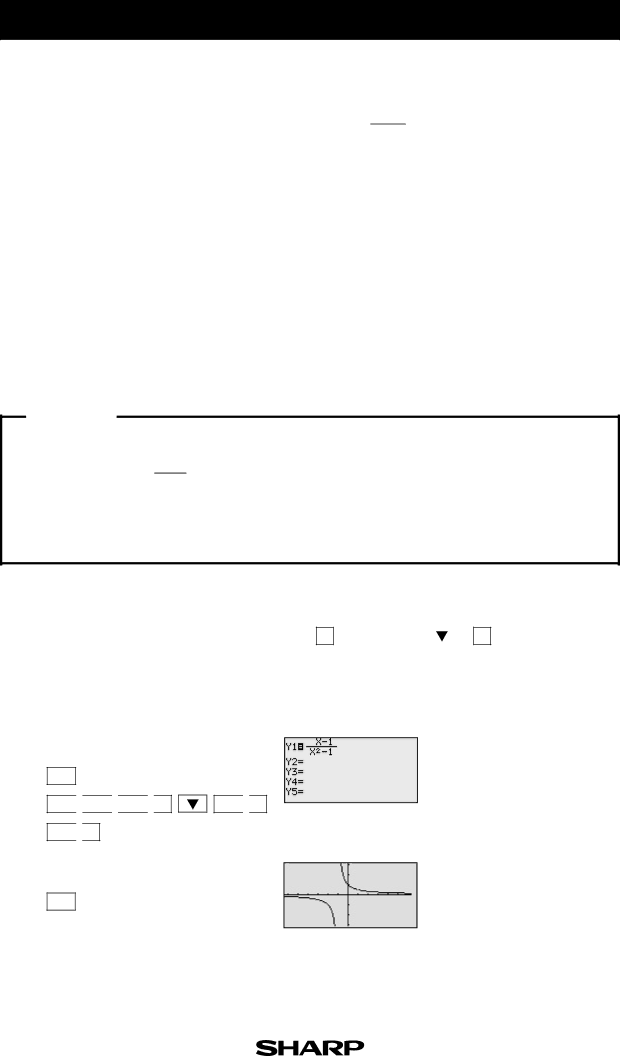
GRAPH
X/![]() /T/n
/T/n![]()
![]() x2
x2
The function consists of two branches separated by the verti- cal asymptote.