Graphing Solution Region of Inequalities
The solution region of an inequality consists of all points (a, b) such that when x = a, and y = b, all inequalities are true.
Example
Check to see if given points are in the solution region of a system of inequalities.
1. Graph the solution region of a system of inequalities:
x + 2y ≤ 1 x 2 + y ≥ 4
2. Which of the following points are within the solution region?
| Before | There may be differences in the results of calculations and graph plotting depending on the setting. |
Starting | Return all settings to the default value and delete all data. | |
|
|
|
Step & Key Operation | Display | Notes |
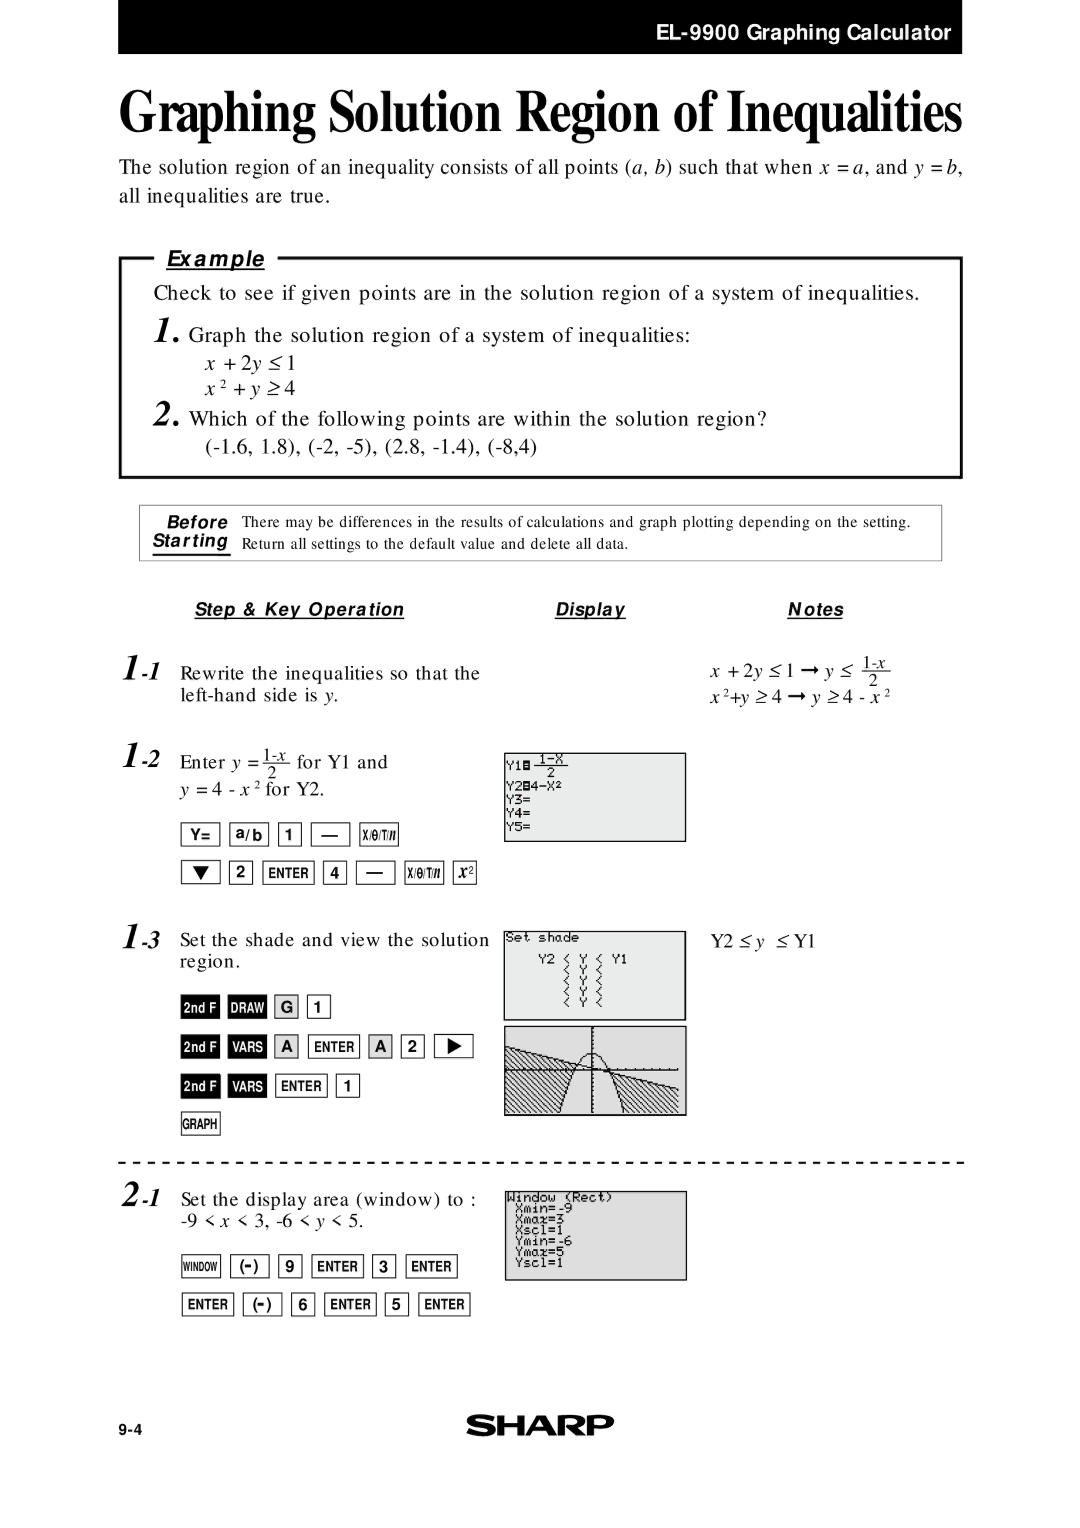
Rewrite the inequalities so that the
Enter y =
Y= ![]()
![]() a/b
a/b ![]()
![]() 1
1 ![]()
![]() —
— ![]()
![]() X/
X/![]() /T/n
/T/n
2 ![]()
![]() ENTER
ENTER ![]()
![]() 4
4 ![]()
![]() —
— ![]()
![]() X/
X/![]() /T/n
/T/n![]()
![]() x2
x2
x + 2y ≤ 1 ➞ y ≤ | |
| 2 |
x 2+y ≥ 4 ➞ y ≥ 4 - x 2
| Y2 ≤ y ≤ Y1 | |||||||
| ||||||||
region. |
|
| ||||||
|
|
|
|
|
|
|
|
|
| 2nd F |
| DRAW |
| G | 1 |
|
|
|
|
|
|
|
|
|
|
|
2nd F ![]()
![]() VARS
VARS ![]()
![]() A
A
ENTER ![]()
![]() A
A ![]()
![]() 2
2
![]() GRAPH2nd F
GRAPH2nd F ![]()
![]() VARS
VARS
GRAPH
ENTER ![]()
![]() 1
1
WINDOW
ENTER
![]()
![]() 9
9
![]()
![]()
![]()
![]() 6
6
ENTER ![]()
![]() 3
3
ENTER ![]()
![]() 5
5
ENTER
ENTER