Solving Rational Function Inequalities
p (x)
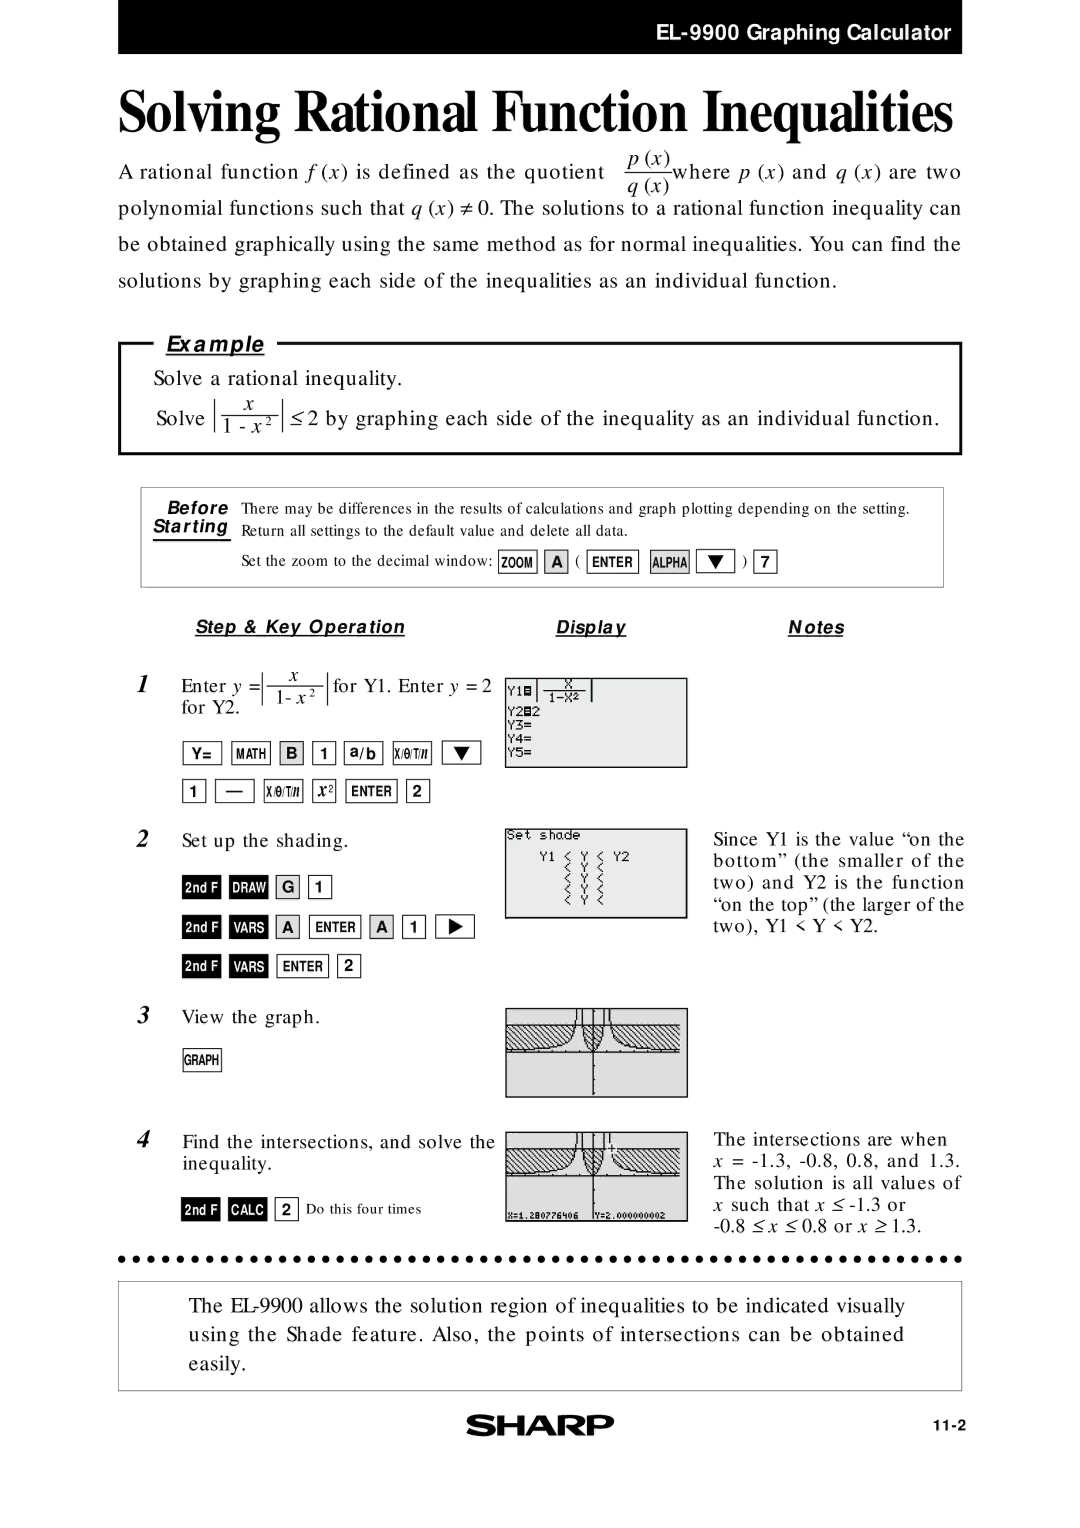
A rational function f (x) is defined as the quotient q (x)where p (x) and q (x) are two polynomial functions such that q (x) ≠ 0. The solutions to a rational function inequality can be obtained graphically using the same method as for normal inequalities. You can find the solutions by graphing each side of the inequalities as an individual function.
Example
Solve a rational inequality.
Solve | x | ≤ 2 by graphing each side of the inequality as an individual function. |
1 - x 2 |
Before There may be differences in the results of calculations and graph plotting depending on the setting. Starting Return all settings to the default value and delete all data.
Set the zoom to the decimal window:
ZOOM ![]()
![]() A
A
(
ENTER ![]()
![]() ALPHA
ALPHA![]()
![]()
)
7
Step & Key Operation | Display | Notes |
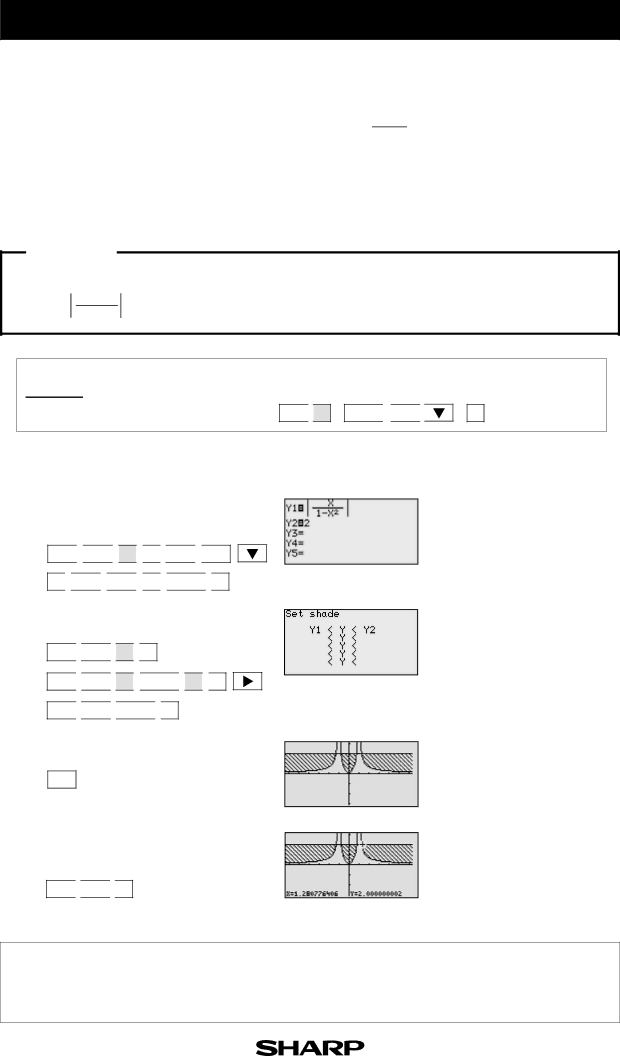
1 | Enter y = |
| x |
| for Y1. Enter y = 2 |
|
| ||||
| 1- x 2 |
| |||
| for Y2. |
|
|
|
|
Y= ![]()
![]() MATH
MATH ![]()
![]() B
B ![]()
![]() 1
1 ![]()
![]() a/b
a/b ![]()
![]() X/
X/![]() /T/n
/T/n
1 ![]()
![]() —
— ![]()
![]() X/
X/![]() /T/n
/T/n![]()
![]() x2
x2 ![]()
![]() ENTER
ENTER ![]()
![]() 2
2
2Set up the shading.
2nd F ![]()
![]() DRAW
DRAW![]()
![]() G
G ![]()
![]() 1
1
2nd F ![]()
![]() VARS
VARS ![]()
![]() A
A ![]()
![]() ENTER
ENTER ![]()
![]() A
A ![]()
![]() 1
1
2nd F ![]()
![]() VARS
VARS ![]()
![]() ENTER
ENTER ![]()
![]() 2
2
3View the graph.
Since Y1 is the value “on the bottom” (the smaller of the two) and Y2 is the function “on the top” (the larger of the two), Y1 < Y < Y2.
GRAPH
4Find the intersections, and solve the inequality.
2nd F ![]()
![]() CALC
CALC ![]()
![]() 2 Do this four times
2 Do this four times
The intersections are when
x=
xsuch that x ≤
The