Step & Key Operation | Display | Notes |
GRAPH ![]()
![]()
![]()
![]() or
or ![]()
![]()
![]() or
or ![]()
![]()
![]() or
or
- | 1 • | 6 | + |
( ) |
|
|
2 ![]()
![]() X
X ![]()
![]() 1
1![]() •
•![]() 8 ...
8 ...
(Continuing key operations omitted.)
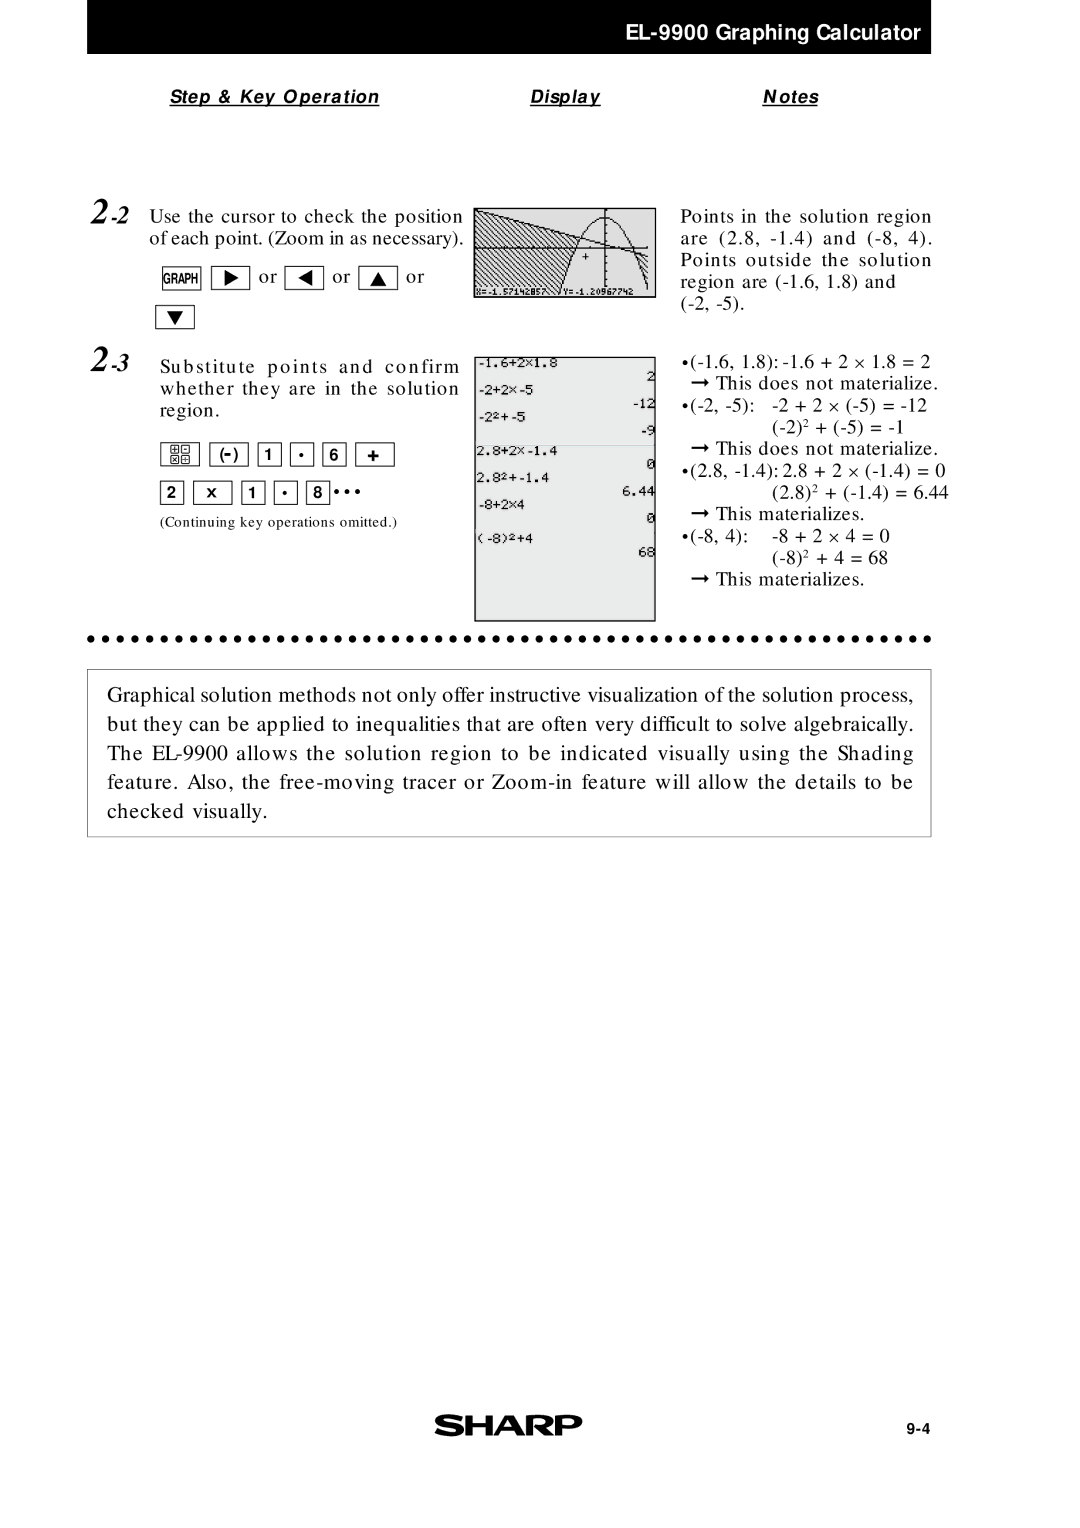
Points in the solution region are (2.8,
. ➞This does not materialize.
. ➞This does not materialize. (2.8,
. ➞This materializes.
➞This materializes.
Graphical solution methods not only offer instructive visualization of the solution process, but they can be applied to inequalities that are often very difficult to solve algebraically. The