Step & Key Operation | Display | Notes |
Y= ![]()
![]() CL
CL ![]()
![]() MATH
MATH ![]()
![]() B
B ![]()
![]() 1
1
3 ![]()
![]() •
• ![]()
![]() 5
5 ![]()
![]() X/
X/![]() /T/n
/T/n ![]()
![]() +
+ ![]()
![]() 4
4 ![]()
![]() ENTER
ENTER
1 ![]()
![]() 0
0
2nd F ![]()
![]() DRAW
DRAW![]()
![]() G
G ![]()
![]() 1
1
2nd F ![]()
![]() VARS
VARS ![]()
![]() A
A ![]()
![]() ENTER
ENTER ![]()
![]() A
A ![]()
![]() 2
2
2nd F ![]()
![]() VARS
VARS ![]()
![]() ENTER
ENTER ![]()
![]() 1
1
Since the inequality you are solving is Y1 > Y2, the solu- tion is where the graph of Y2 is “on the bottom” and Y1 in “on the top.”
WINDOW ![]()
![]()
![]()
![]() 1
1 ![]()
![]() 0
0 ![]()
![]() ENTER
ENTER ![]()
![]() 1
1 ![]()
![]() 0
0
ENTER ![]()
![]() ENTER
ENTER ![]()
![]()
![]()
![]() 5
5 ![]()
![]() ENTER
ENTER ![]()
![]() 5
5 ![]()
![]() 0
0
ENTER ![]()
![]() 5
5 ![]()
![]() ENTER
ENTER
2nd F ![]()
![]() CALC
CALC ![]()
![]() 2 ➞ x =
2 ➞ x =
2nd F 
 CALC
CALC 
 2 ➞ x = 1.714285714
y = 9.999999999 ( Note)
Note)
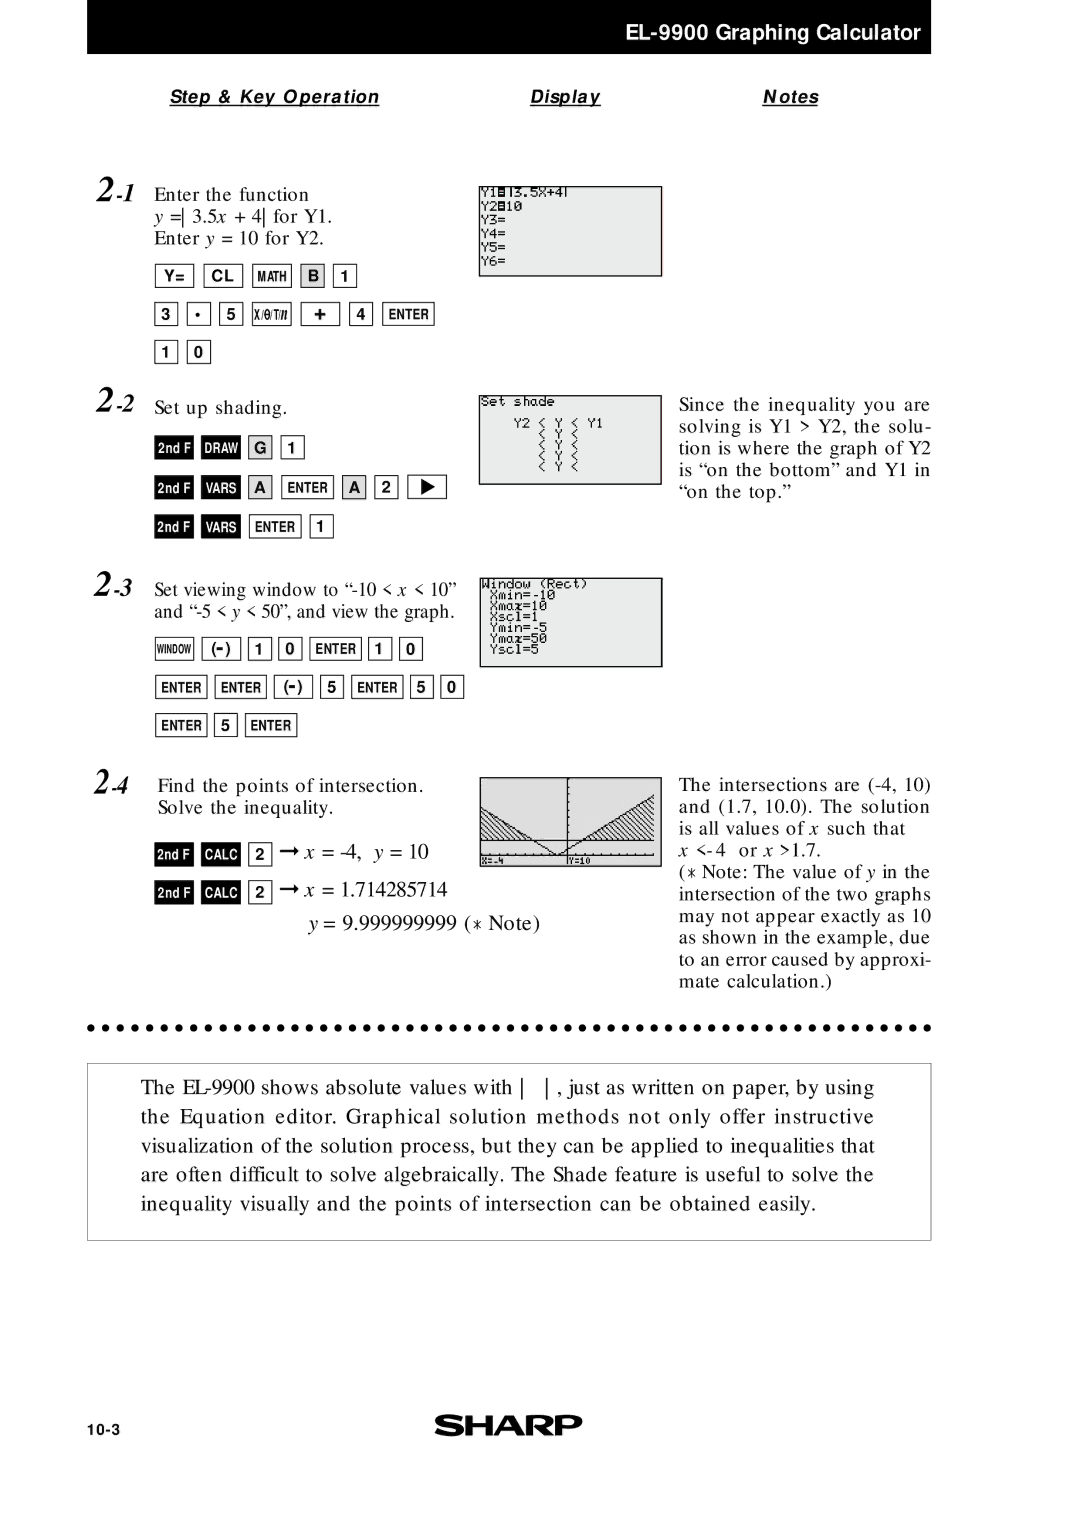
The intersections are
x <- 4 or x >1.7.
(![]() Note: The value of y in the intersection of the two graphs may not appear exactly as 10 as shown in the example, due to an error caused by approxi- mate calculation.)
Note: The value of y in the intersection of the two graphs may not appear exactly as 10 as shown in the example, due to an error caused by approxi- mate calculation.)
The