Parallel and Perpendicular Lines
Parallel and perpendicular lines can be drawn by changing the slope of the linear equation and the y intercept. A linear equation of y in terms of x can be expressed by the slope- intercept form y = mx + b, where m is the slope and b is the
Parallel lines have an equal slope with different
Example
Graph parallel lines and perpendicular lines.
1. Graph the equations y = 3x + 1 and y = 3x + 2.
2. Graph the equations y = 3x - 1 and y = - 31 x + 1.
Before | There may be differences in the results of calculations and graph plotting depending on the setting. |
Starting | Return all settings to the default value and delete all data. |
Set the zoom to the decimal window:
ZOOM ![]()
![]() C
C
(
ENTER ![]()
![]() ALPHA
ALPHA![]()
![]()
)
7
Step & Key Operation | Display | Notes |
Enter the equations y = 3x + 1 for Y1 and y = 3x + 2 for Y2.
Y= |
| 3 |
| X/ /T/n |
| + | 1 | ENTER |
|
|
|
|
|
|
|
|
|
3 |
| n |
| + | 2 |
|
| |
X/ /T/ |
|
|
| |||||
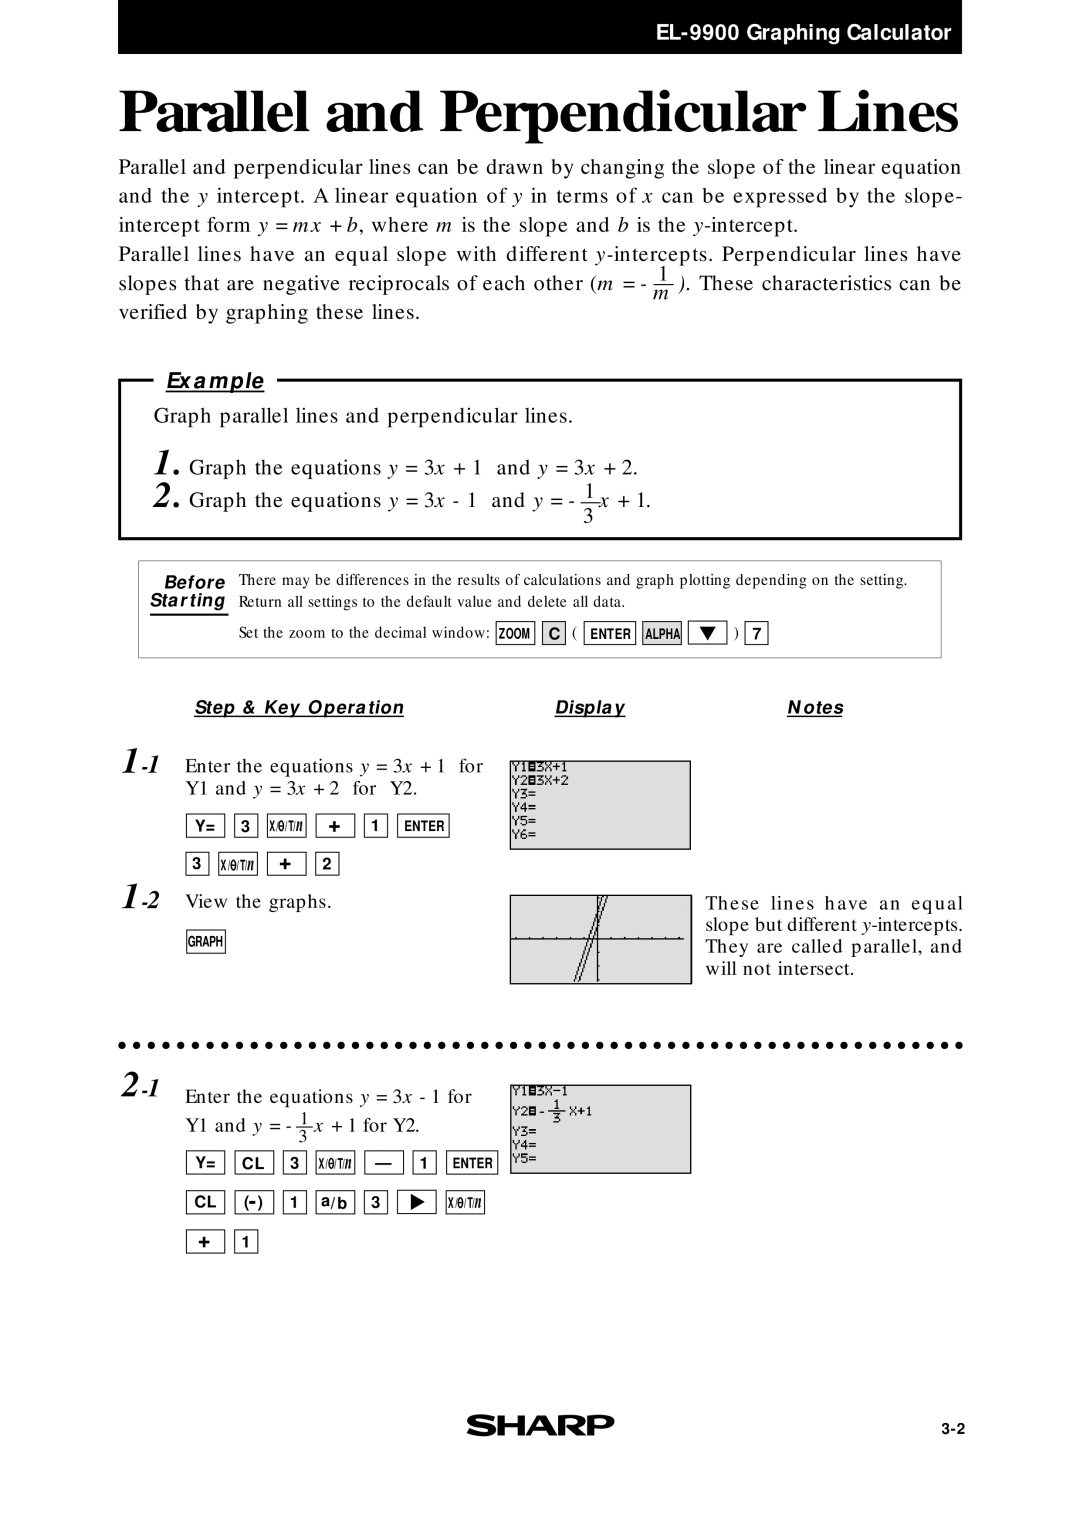
View the graphs.
GRAPH
Enter the equations y = 3x - 1 for Y1 and y = - 31 x + 1 for Y2.
Y= ![]()
![]() CL
CL ![]()
![]() 3
3 ![]()
![]() X/
X/![]() /T/n
/T/n![]()
![]() —
— ![]()
![]() 1
1 ![]()
![]() ENTER
ENTER
CL |
| 1 | a/b | 3 |
|
| X/ /T/n |
+ ![]()
![]() 1
1
These lines have an equal slope but different