Step & Key Operation | Display | Notes |
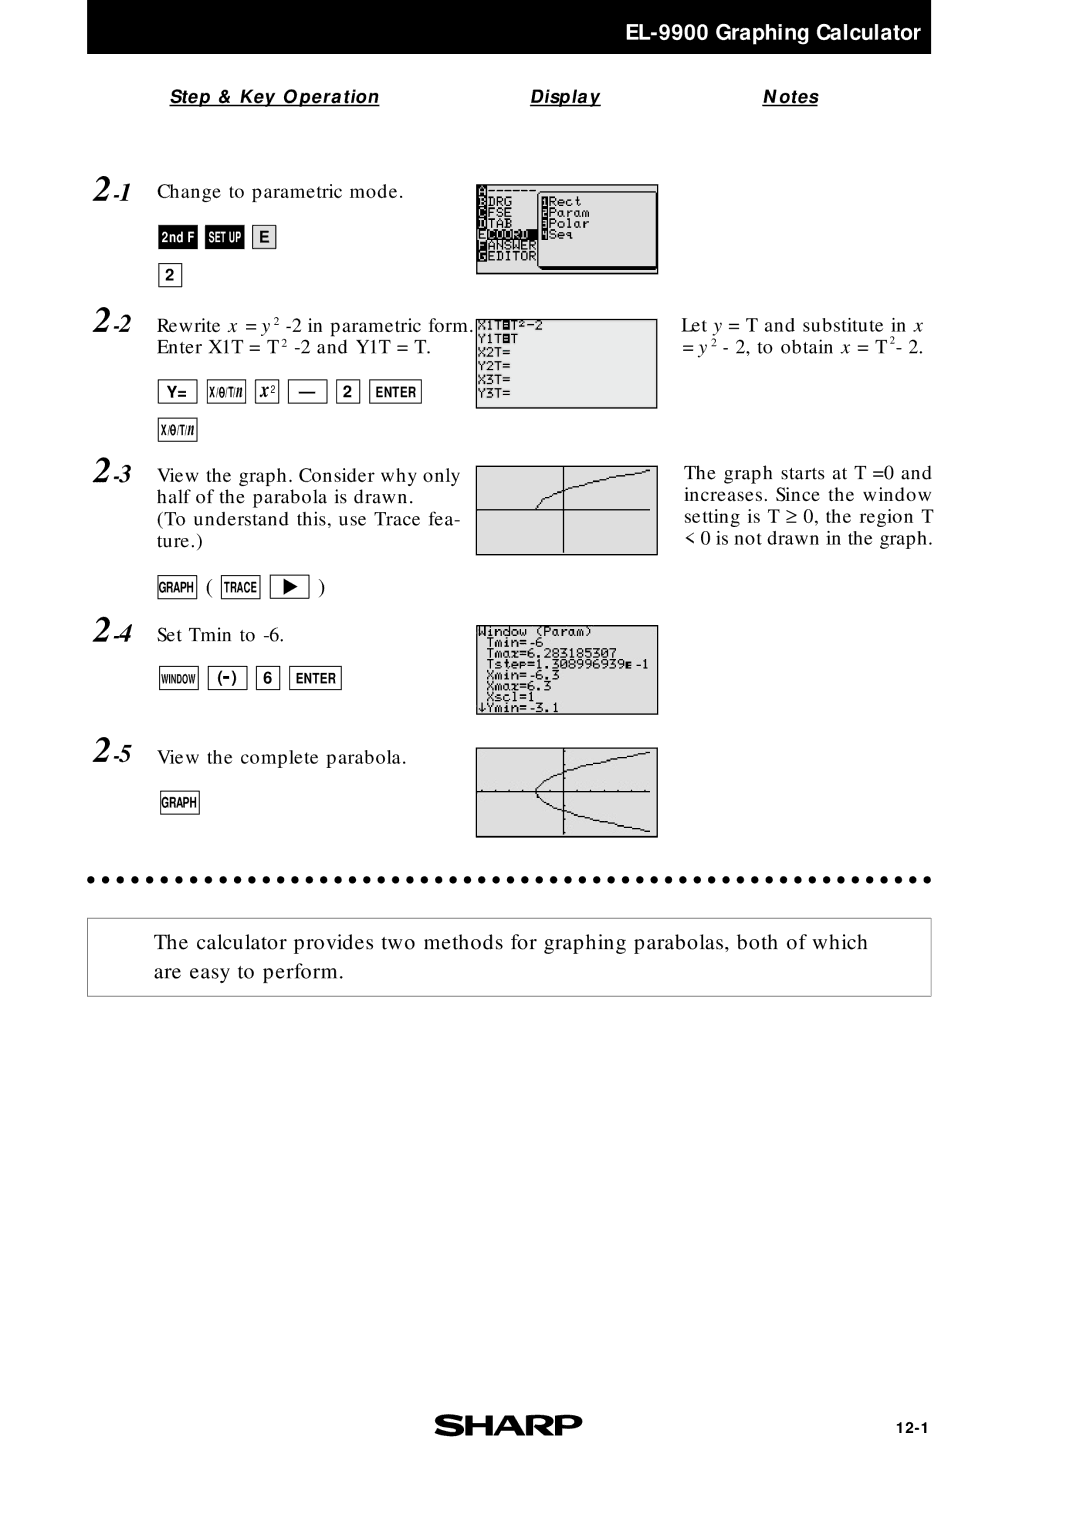
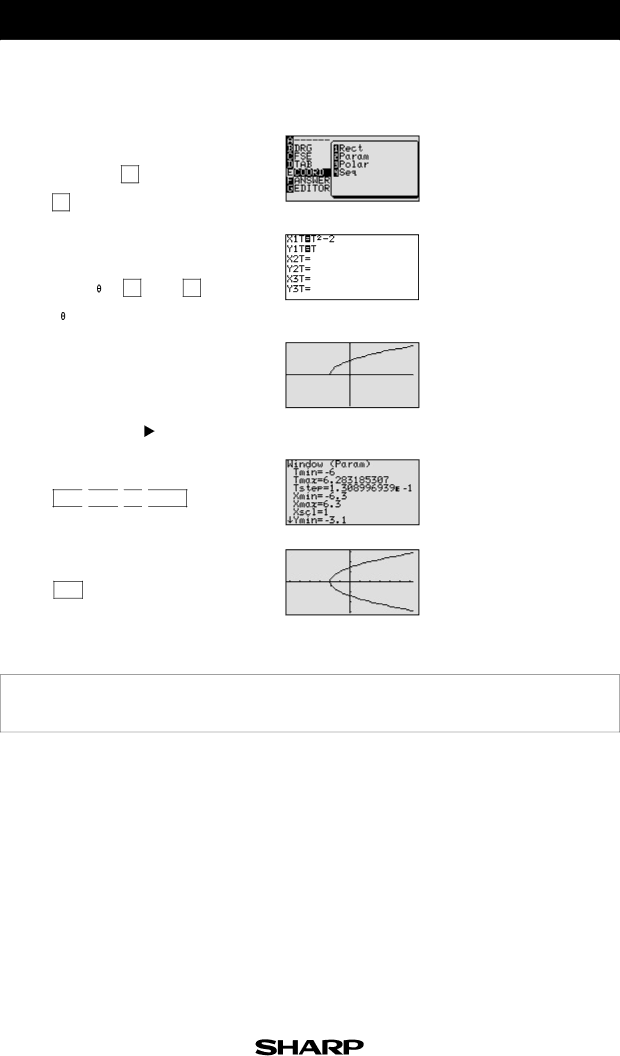
Change to parametric mode. |
|
| |||||||||||
|
|
|
|
|
|
|
|
|
|
|
|
|
|
|
| 2nd F |
| SET UP |
| E |
|
|
|
|
|
|
|
| 2 |
|
|
|
|
|
|
|
|
|
|
| |
Rewrite x = y 2 |
| Let y = T and substitute in x | |||||||||||
| |||||||||||||
| Enter X1T = T 2 |
| = y 2 - 2, to obtain x = T 2- 2. | ||||||||||
|
|
|
|
|
| x2 |
| 2 |
|
|
|
| |
|
| Y= |
| X/ /T/n |
| — | ENTER |
|
|
| |||
|
|
|
|
|
|
|
|
|
|
|
|
|
|
|
| X/ /T/n |
|
|
|
|
|
|
|
|
|
|
|
(To understand this, use Trace fea- ture.)
GRAPH | ( | TRACE |
|
| ) |
WINDOW ![]()
![]()
![]()
![]() 6
6 ![]()
![]() ENTER
ENTER
The graph starts at T =0 and increases. Since the window setting is T ≥ 0, the region T < 0 is not drawn in the graph.
GRAPH
The calculator provides two methods for graphing parabolas, both of which are easy to perform.