Pie Charts and Proportions
Pie charts enable a quick and clear overview of how portions of data relate to the whole.
Example
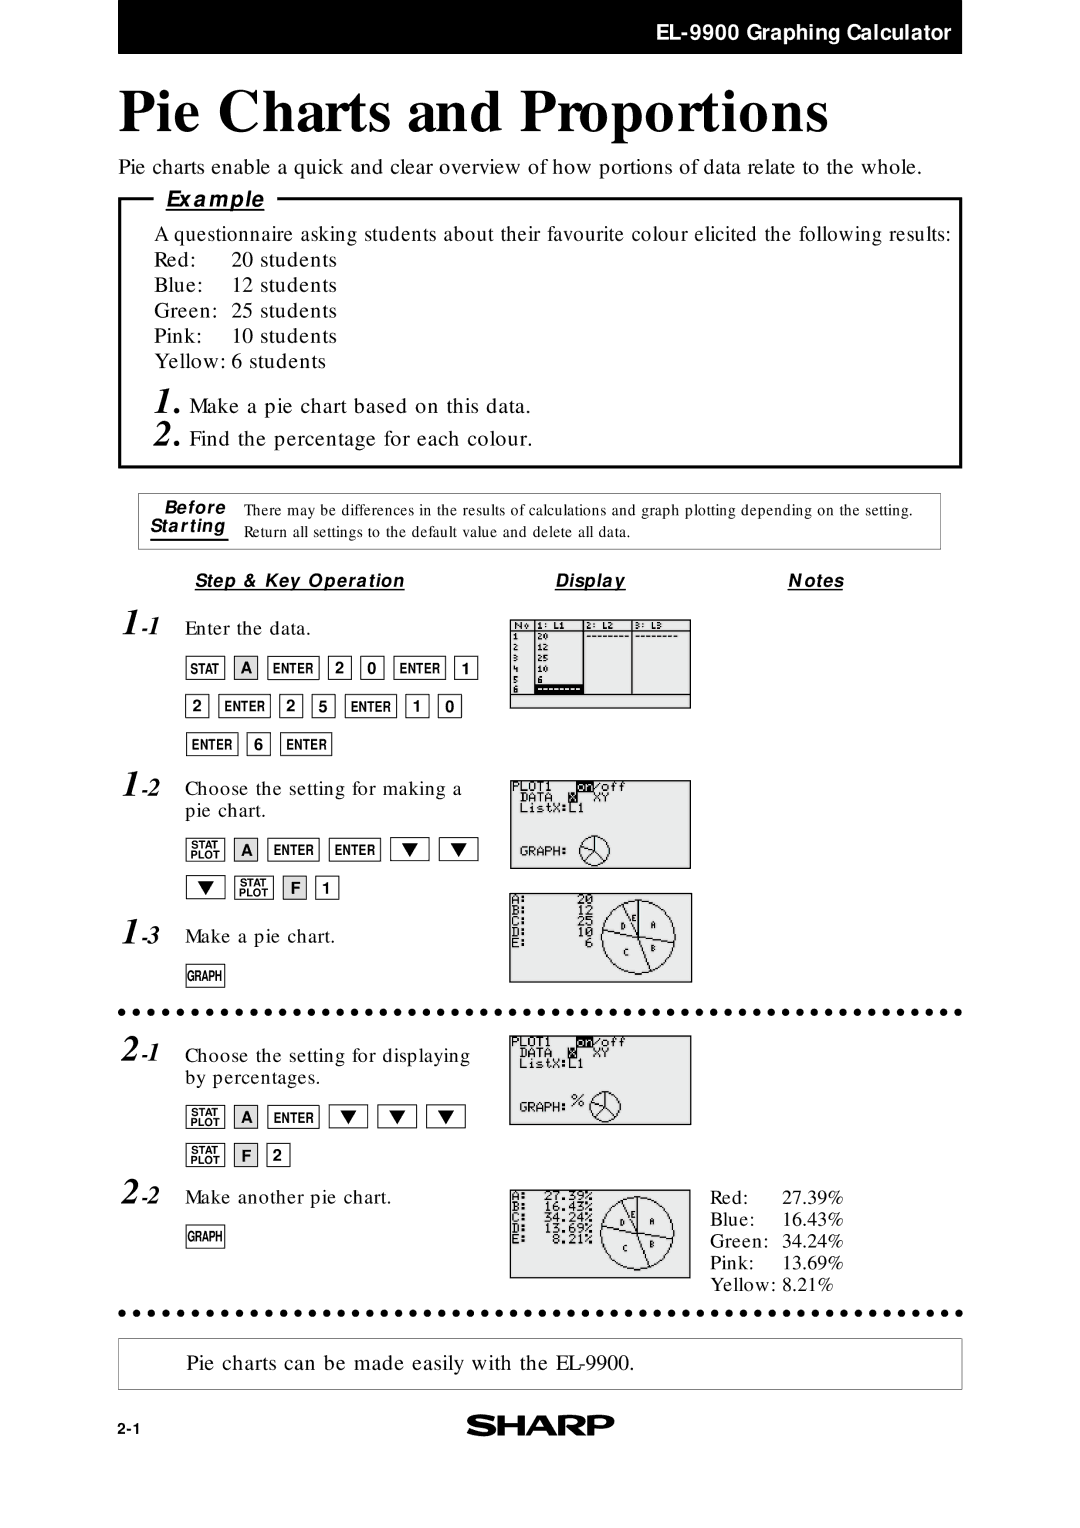
A questionnaire asking students about their favourite colour elicited the following results: Red: 20 students
Blue: 12 students
Green: 25 students
Pink: 10 students
Yellow: 6 students
1. Make a pie chart based on this data.
2. Find the percentage for each colour.
| Before | There may be differences in the results of calculations and graph plotting depending on the setting. | ||
Starting | Return all settings to the default value and delete all data. |
| ||
|
|
|
|
|
| Step & Key Operation | Display | Notes | |
STAT ![]()
![]() A
A ![]()
![]() ENTER
ENTER ![]()
![]() 2
2 ![]()
![]() 0
0 ![]()
![]() ENTER
ENTER ![]()
![]() 1
1
2 ![]()
![]() ENTER
ENTER ![]()
![]() 2
2 ![]()
![]() 5
5 ![]()
![]() ENTER
ENTER ![]()
![]() 1
1 ![]()
![]() 0
0
ENTER ![]()
![]() 6
6 ![]()
![]() ENTER
ENTER
STAT A ENTER ENTER
PLOT
STAT F 1
PLOT
GRAPH
STAT |
| A |
| ENTER |
PLOT |
|
| ||
|
|
|
|
|
STAT |
| F | 2 | |
PLOT |
| |||
GRAPH
Red: 27.39%
Blue: 16.43%
Green: 34.24%
Pink: 13.69%
Yellow: 8.21%
Pie charts can be made easily with the