|
|
|
|
|
|
Step & Key Operation | Display | Notes |
|
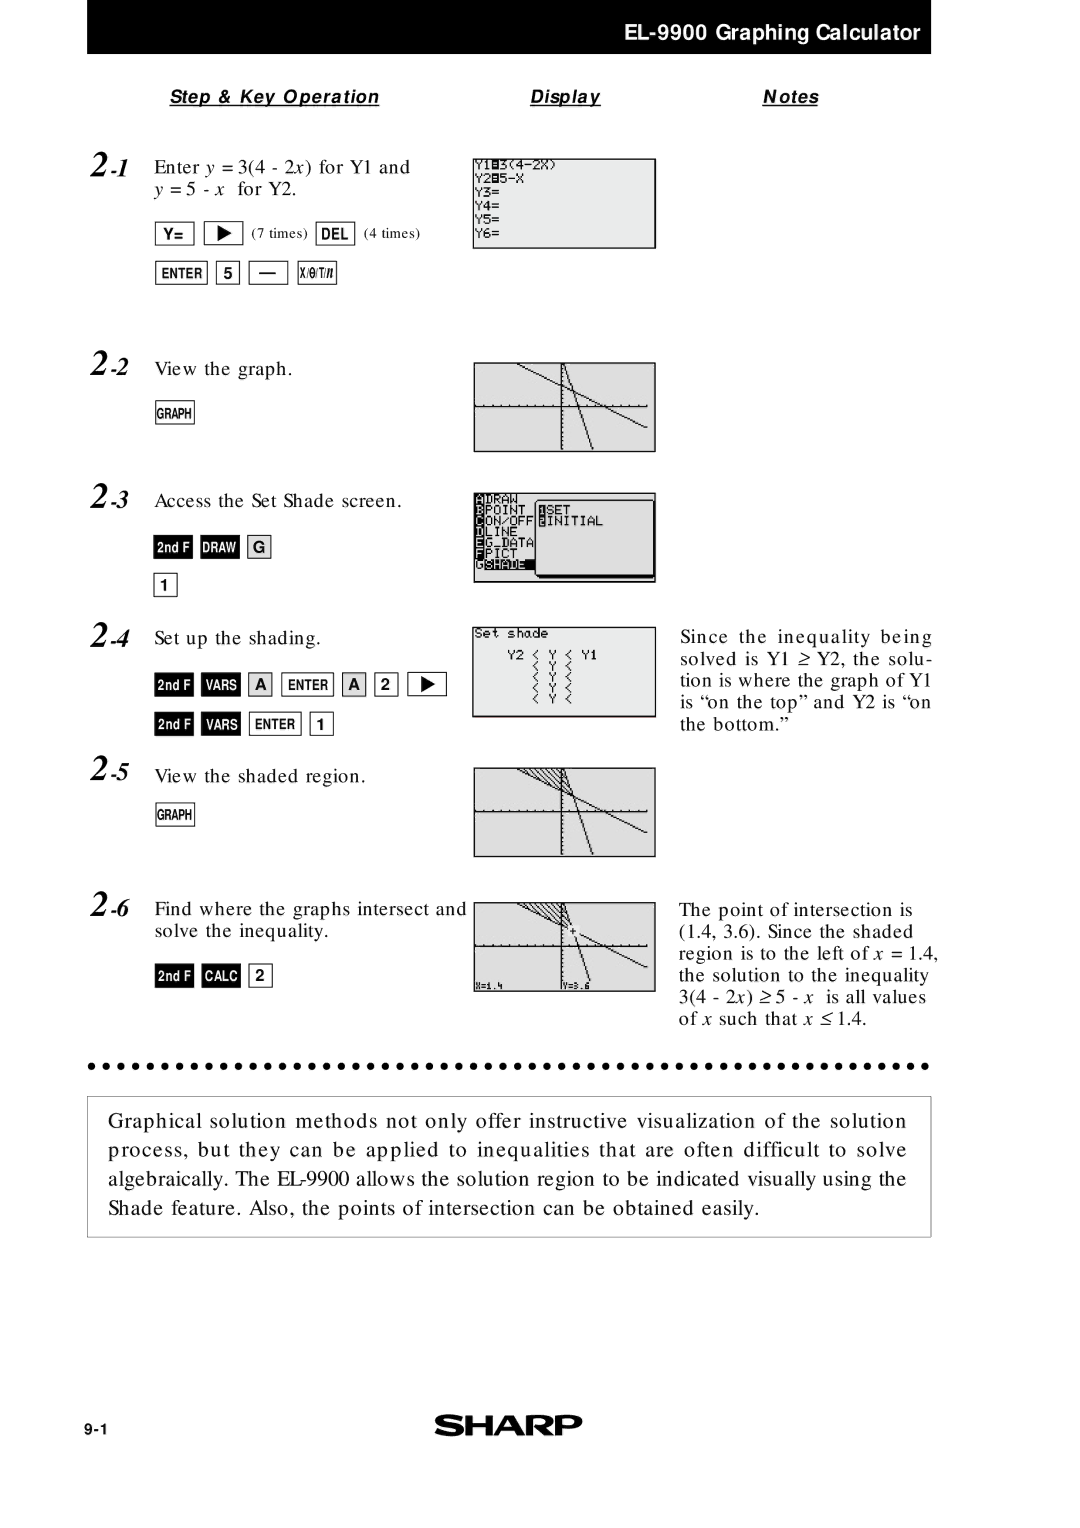
| |
y = 5 - x for Y2. |
|
|
Y= ![]()
![]()
![]()
![]() (7 times) DEL
(7 times) DEL
ENTER ![]()
![]() 5
5 ![]()
![]() —
— ![]()
![]() X/
X/![]() /T/n
/T/n
(4 times)
GRAPH
2nd F ![]()
![]() DRAW
DRAW ![]()
![]() G
G
1
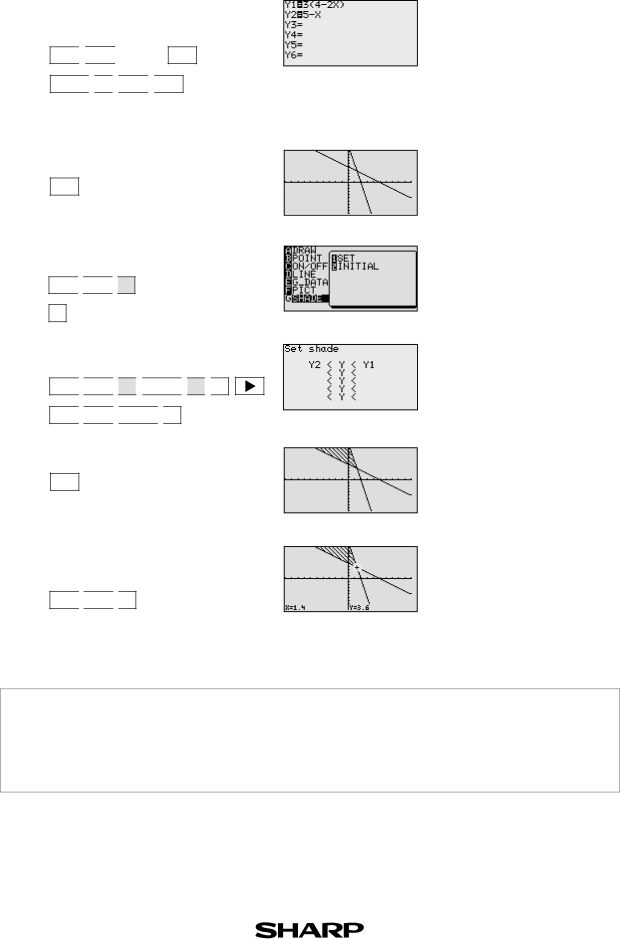
Set up the shading.
![]()
![]() VARS
VARS ![]()
![]() A
A ![]()
![]() ENTER
ENTER ![]()
![]() A
A ![]()
![]() 2
2
2nd F ![]()
![]() VARS
VARS ![]()
![]() ENTER
ENTER ![]()
![]() 1
1
View the shaded region.
GRAPH
Find where the graphs intersect and solve the inequality.
2nd F ![]()
![]() CALC
CALC ![]()
![]() 2
2
Since the inequality being solved is Y1 ≥ Y2, the solu- tion is where the graph of Y1 is “on the top” and Y2 is “on the bottom.”
The point of intersection is (1.4, 3.6). Since the shaded region is to the left of x = 1.4, the solution to the inequality 3(4 - 2x) ≥ 5 - x is all values of x such that x ≤ 1.4.
Graphical solution methods not only offer instructive visualization of the solution process, but they can be applied to inequalities that are often difficult to solve algebraically. The