Slope and Intercept of Linear Equations
A linear equation of y in terms of x can be expressed by the
Example
Draw graphs of two equations by changing the slope or the y- intercept.
1. Graph the equations y = x and y = 2x.
2. Graph the equations y = x and y = 12 x.
3. Graph the equations y = x and y = - x.
4. Graph the equations y = x and y = x + 2.
| Before | There may be differences in the results of calculations and graph plotting depending on the setting. | ||
Starting | Return all settings to the default value and delete all data. |
| ||
|
|
|
|
|
| Step & Key Operation | Display | Notes | |
Y=
X/![]() /T/n
/T/n
ENTER ![]()
![]() 2
2
X/![]() /T/n
/T/n
GRAPH
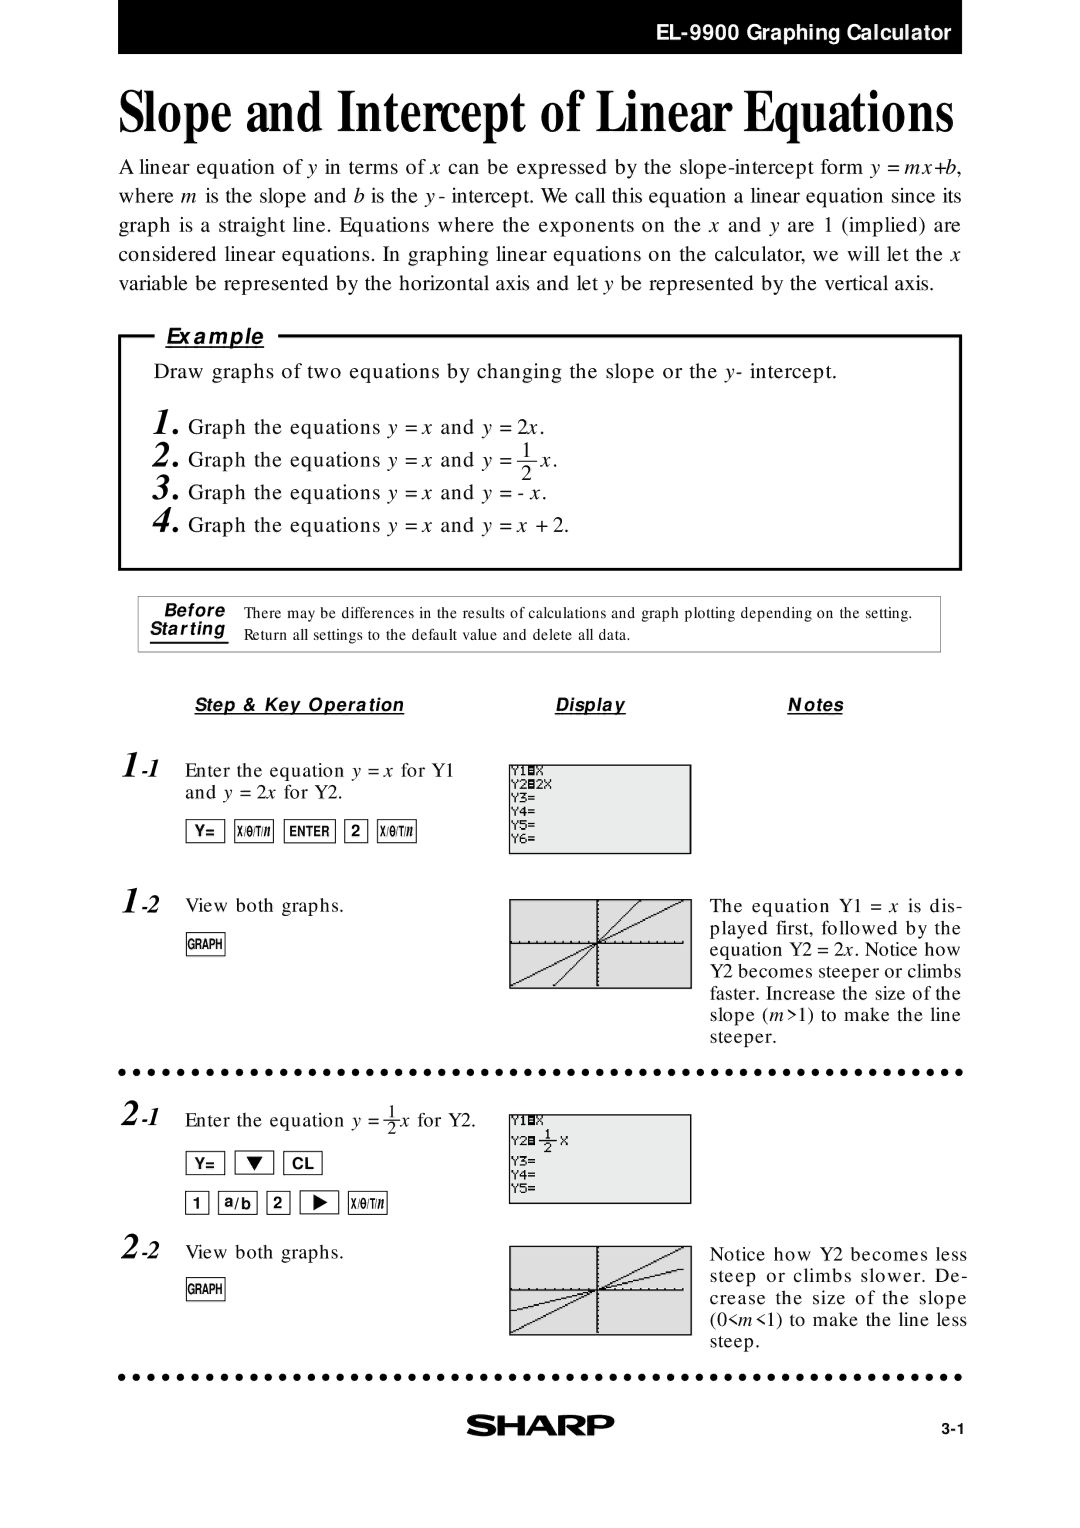
The equation Y1 = x is dis- played first, followed by the equation Y2 = 2x. Notice how Y2 becomes steeper or climbs faster. Increase the size of the slope (m>1) to make the line steeper.
Enter the equation y = | 1 | x for Y2. | |||||||||||||
2 | |||||||||||||||
|
|
|
|
|
|
|
|
|
|
|
|
|
|
|
|
|
| Y= |
|
|
|
| CL |
|
|
|
|
|
| ||
|
|
|
|
|
|
|
|
|
|
|
|
|
| ||
|
| 1 | a/b | 2 |
|
|
| X/ /T/n | |||||||
View both graphs. | |||||||||||||||
|
|
|
|
|
|
|
|
|
|
|
| ||||
|
| GRAPH |
|
|
|
|
|
|
|
|
| ||||
|
|
|
|
|
|
|
|
|
|
|
|
|
|
|
|
Notice how Y2 becomes less steep or climbs slower. De- crease the size of the slope (0<m<1) to make the line less steep.