System of Two-Variable Inequalities
The solution region of a system of
Example
Solve a system of
x 2 + y ≤ 1
Before There may be differences in the results of calculations and graph plotting depending on the setting. Starting Return all settings to the default value and delete all data.
|
|
| Set the zoom to the decimal window: | ZOOM |
| A | ( | ENTER |
| 2nd F |
|
| ) 7 |
|
|
|
|
|
|
|
|
|
|
|
|
| |||||
|
| Step & Key Operation |
| Display |
|
|
| Notes |
| ||||||
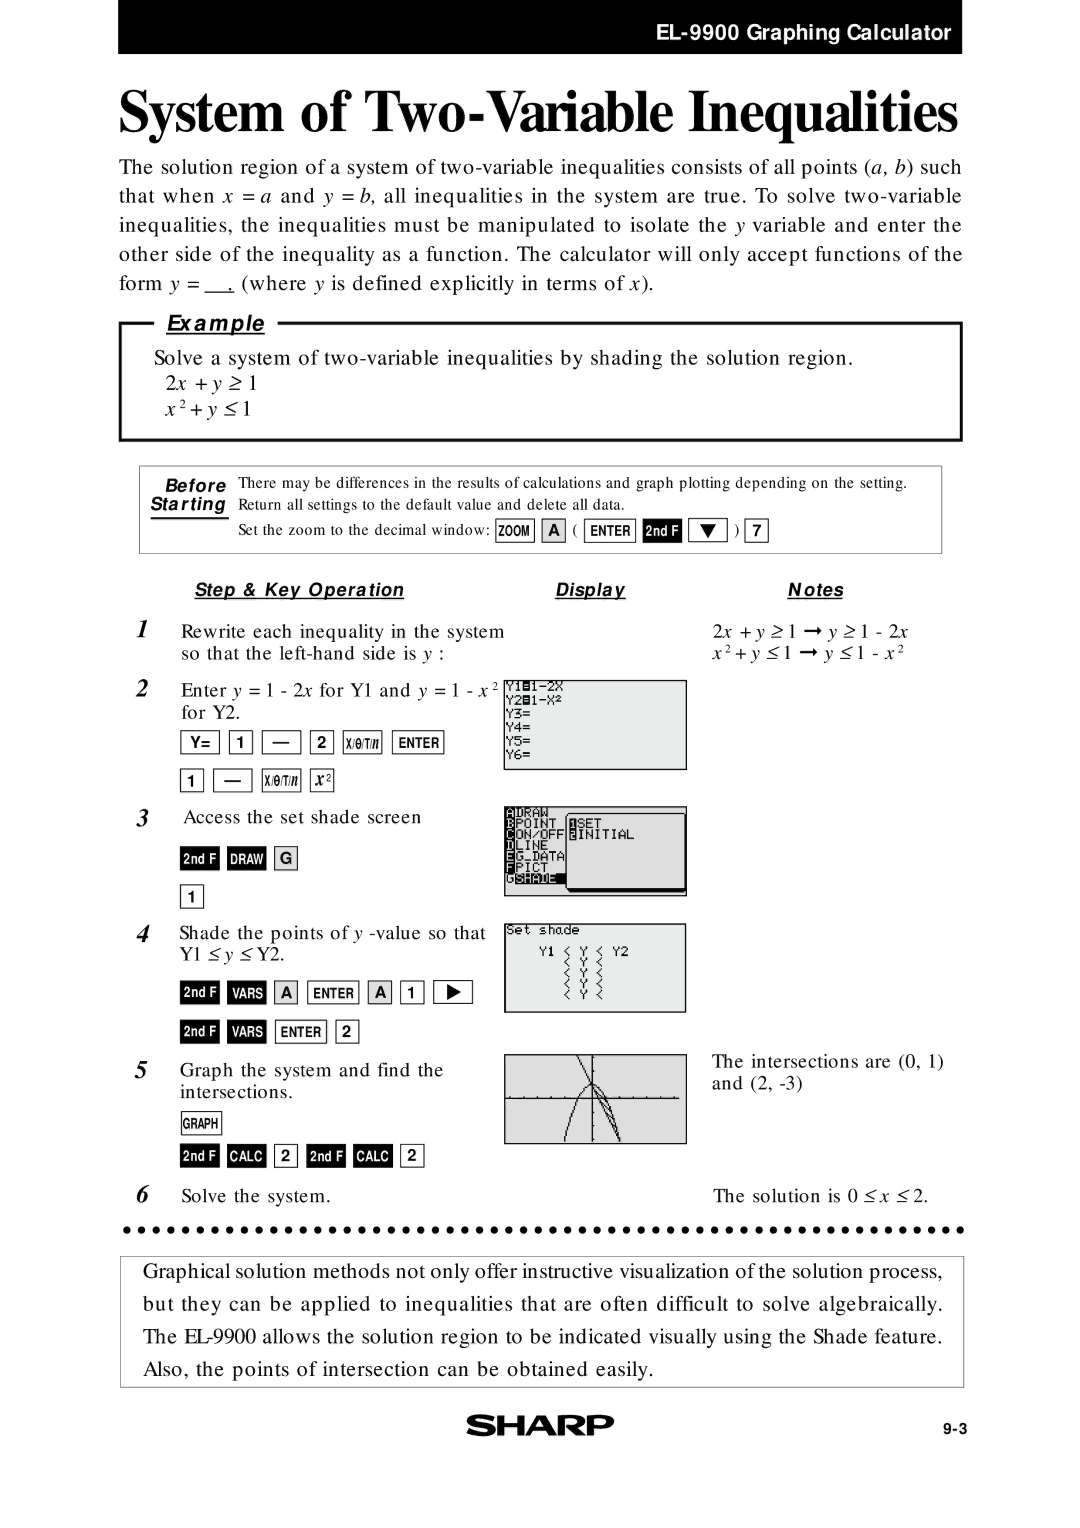
1 Rewrite each inequality in the system |
|
|
|
|
|
|
| 2x + y ≥ | 1 ➞ y ≥ | 1 - 2x | |||||
|
| so that the |
|
|
|
|
|
|
| x 2 + y ≤ | 1 ➞ y ≤ | 1 - x 2 | |||
2Enter y = 1 - 2x for Y1 and y = 1 - x 2 for Y2.
Y= ![]()
![]() 1
1
1 ![]()
![]() —
—
—![]()
![]() 2
2 ![]()
![]() X/
X/![]() /T/n
/T/n
X/![]() /T/n
/T/n![]()
![]() x2
x2
ENTER
3Access the set shade screen
2nd F ![]()
![]() DRAW
DRAW ![]()
![]() G
G
1
4Shade the points of y
2nd F ![]()
![]() VARS
VARS ![]()
![]() A
A ![]()
![]() ENTER
ENTER ![]()
![]() A
A ![]()
![]() 1
1
2nd F ![]()
![]() VARS
VARS ![]()
![]() ENTER
ENTER ![]()
![]() 2
2
5Graph the system and find the intersections.
GRAPH
2nd F ![]()
![]() CALC
CALC ![]()
![]() 2
2 ![]()
![]() 2nd F
2nd F ![]()
![]() CALC
CALC ![]()
![]() 2
2
6Solve the system.
The intersections are (0, 1) and (2,
The solution is 0 ≤ x ≤ 2.
Graphical solution methods not only offer instructive visualization of the solution process, but they can be applied to inequalities that are often difficult to solve algebraically. The