Graphing Polynomials and Tracing to Find the Roots
A polynomial y = f (x) is an expression of the sums of several terms that contain different powers of the same originals. The roots are found at the intersection of the
Example
Draw a graph of a polynomial and approximate the roots by using the
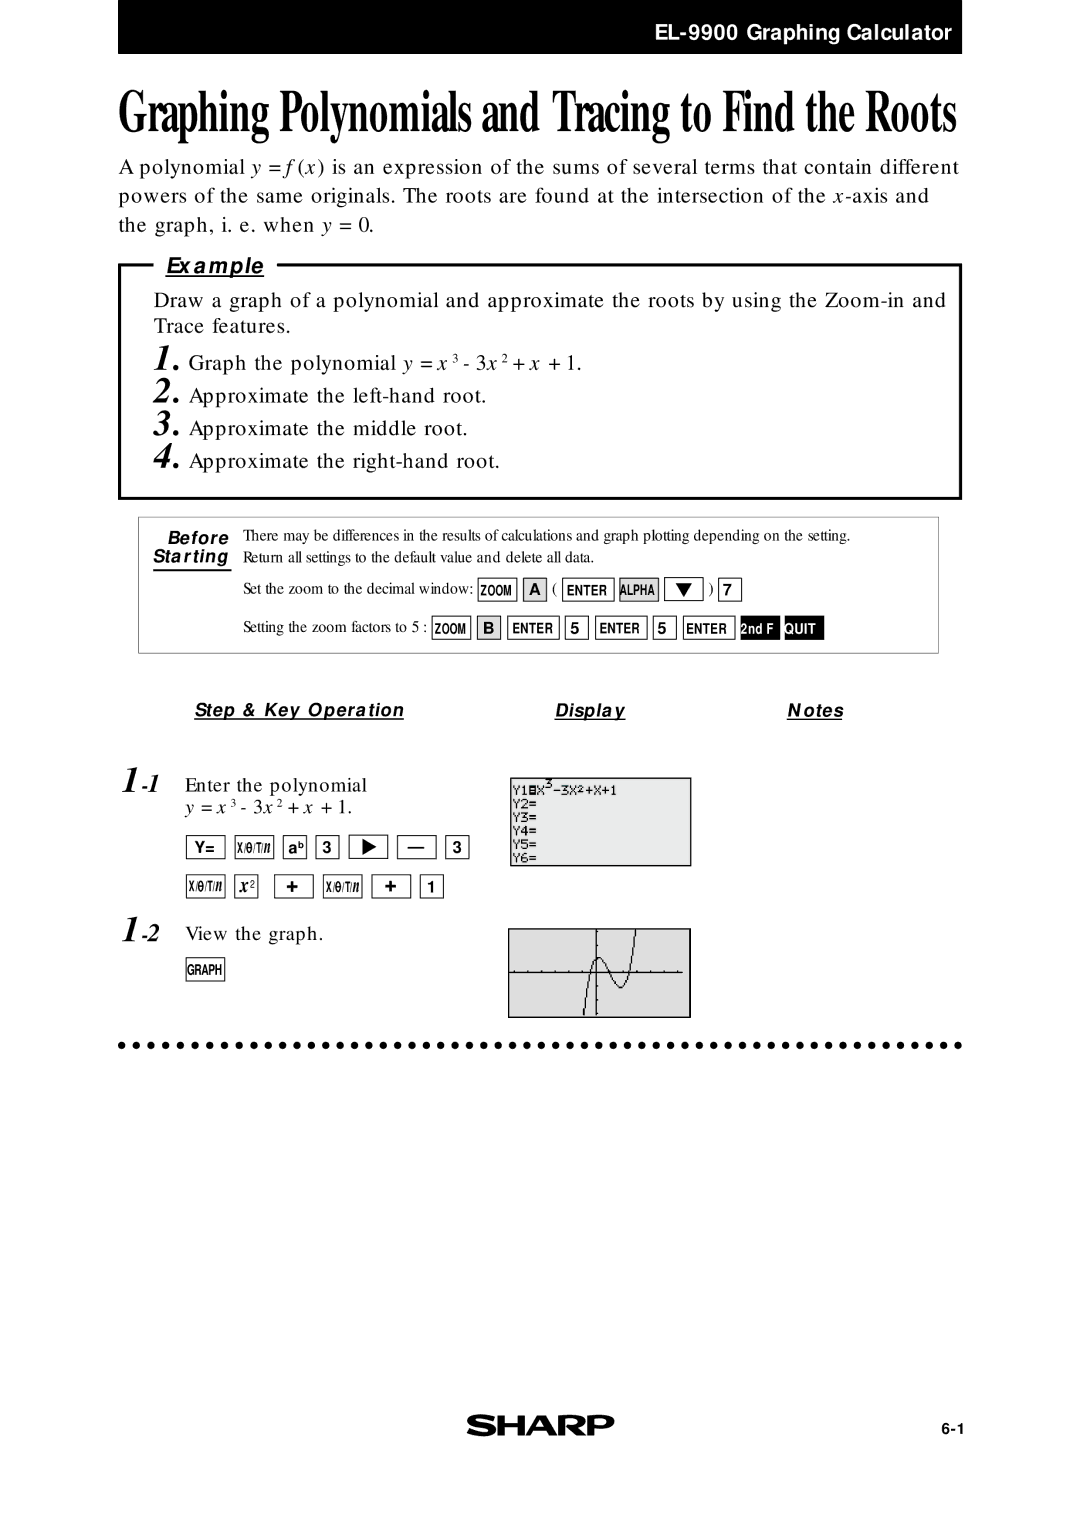
1. Graph the polynomial y = x 3 - 3x 2 + x + 1.
2. Approximate the
3. Approximate the middle root.
4. Approximate the
Before
Starting
There may be differences in the results of calculations and graph plotting depending on the setting. Return all settings to the default value and delete all data.
Set the zoom to the decimal window: | ZOOM |
| A | ( |
| ENTER |
| ALPHA |
|
|
|
| ) | 7 |
|
|
|
| |||||||||
|
|
|
|
|
|
|
|
|
|
|
|
|
|
|
|
|
|
| |||||||||
Setting the zoom factors to 5 : | ZOOM |
|
| B |
| ENTER |
| 5 |
| ENTER |
| 5 |
| ENTER |
| 2nd F |
| QUIT | |||||||||
Step & Key Operation | Display | Notes |
Y= ![]()
![]() X/
X/![]() /T/n
/T/n ![]()
![]() ab
ab ![]()
![]() 3
3
X/ /T/n | x | 2 | + | n | + |
| X/ /T/ |
—![]()
![]() 3
3
![]()
![]() 1
1
GRAPH