Using the Avaya Remote Supervisor Adapter
Viewing system health summary
Viewing system health summary
To view the System Health of the S8500 Media Server, select System Health under the Monitors heading in the navigation pane. The following information appears under the System Health Summary:
•Server power: Indicates the server is either On or Off.
•Server state: Shows the current state of the S8500 Media Server.
A circle that indicates the overall health of the S8500 Media Server:
•Green: Indicates that the S8500 Media Server is operating normally
•Red circle with an X: One or more monitored parameters are abnormal.
•Yellow triangle with an exclamation point: One of more monitored parameters are abnormal.
If the circle is either red or yellow: more detailed information concerning the problem can be found in the System Health Summary section.
Environmentals
The RSA monitors current temperature readings and threshold levels for various components of the S8500 Media Server. To obtain more information about a specific value, click on the number associated with the component under the Value field.
Temperature thresholds
The RSA tracks the current temperature readings and threshold levels for system components.
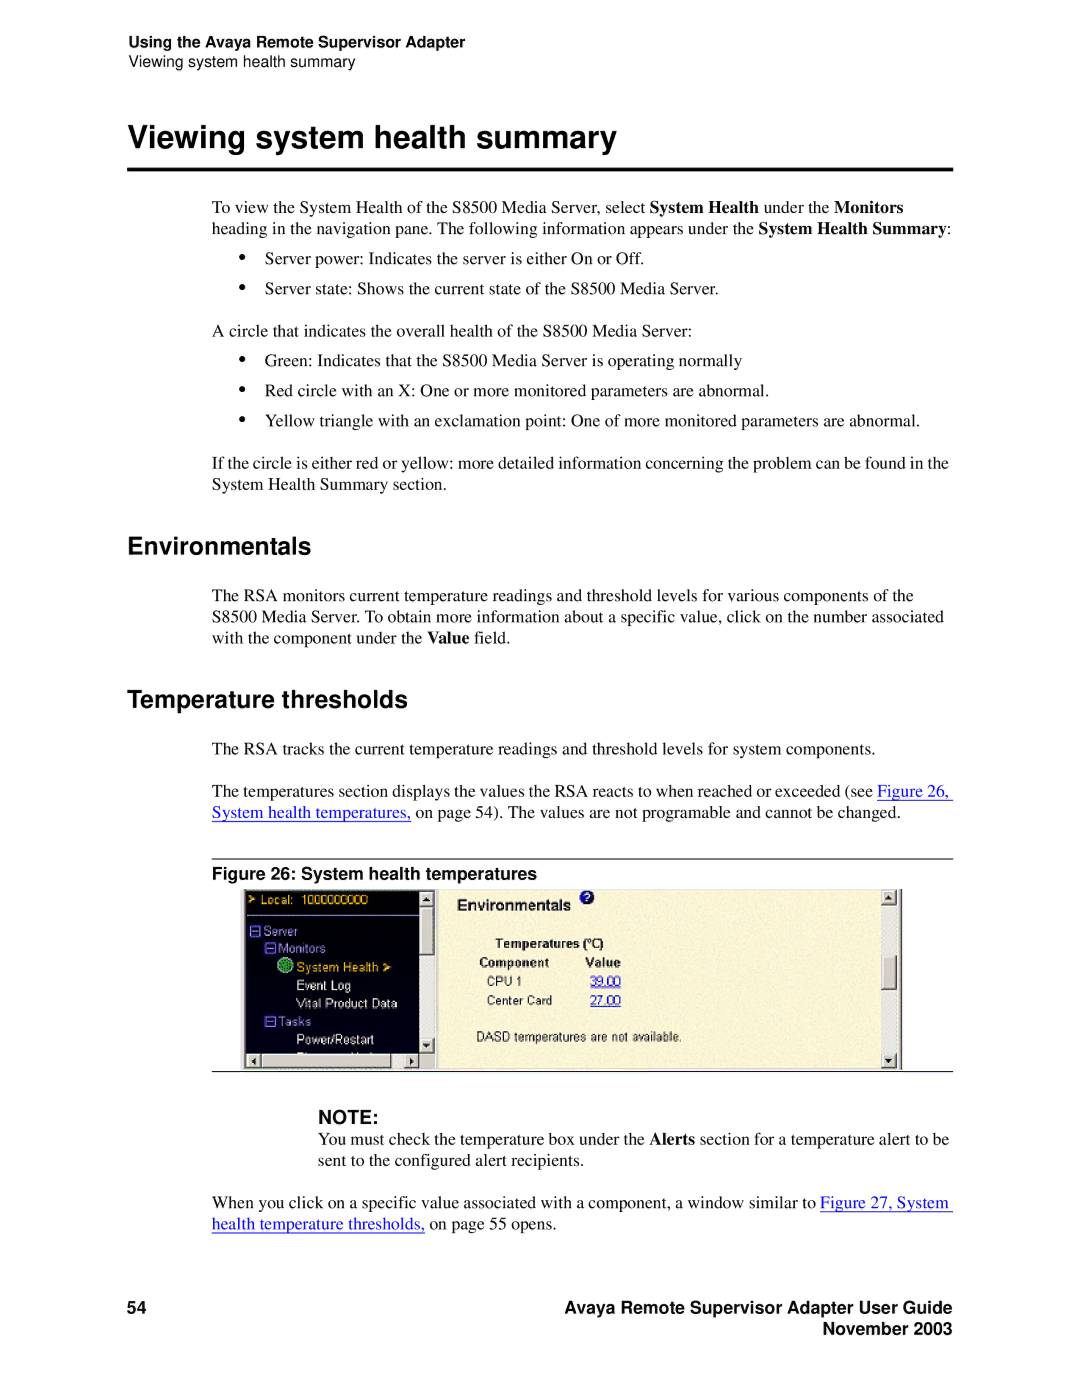
The temperatures section displays the values the RSA reacts to when reached or exceeded (see Figure 26, System health temperatures, on page 54). The values are not programable and cannot be changed.
Figure 26: System health temperatures
NOTE:
You must check the temperature box under the Alerts section for a temperature alert to be sent to the configured alert recipients.
When you click on a specific value associated with a component, a window similar to Figure 27, System health temperature thresholds, on page 55 opens.
54 | Avaya Remote Supervisor Adapter User Guide |
| November 2003 |
