Performance analysis
After a test has completed, the analyze tool (see “Utility commands” (page 51)) runs on the test output. The analyze tool compares the performance of all tested nodes to the mean value, and identifies the nodes outside the acceptable range. The performance of each node is also compared to the standard deviation. The full analysis is saved to a analysis log file (for example
090406_070956_runstreams.analysis) in the current logs directory. Currently, only CrissCross, Stream, Linpack, Disk Test, Netperf, InfiniBand Verbs Test, and Pallas Test have performance analyses.
If the performance of some nodes is less than the mean value by three standard deviations, these nodes are marked as outside the acceptable range. The nodes outside the acceptable range are included in the analysis summary. In cases where a large standard deviation is detected, a warning is issued – you should review the analysis file in order to detect nodes with lower performance.
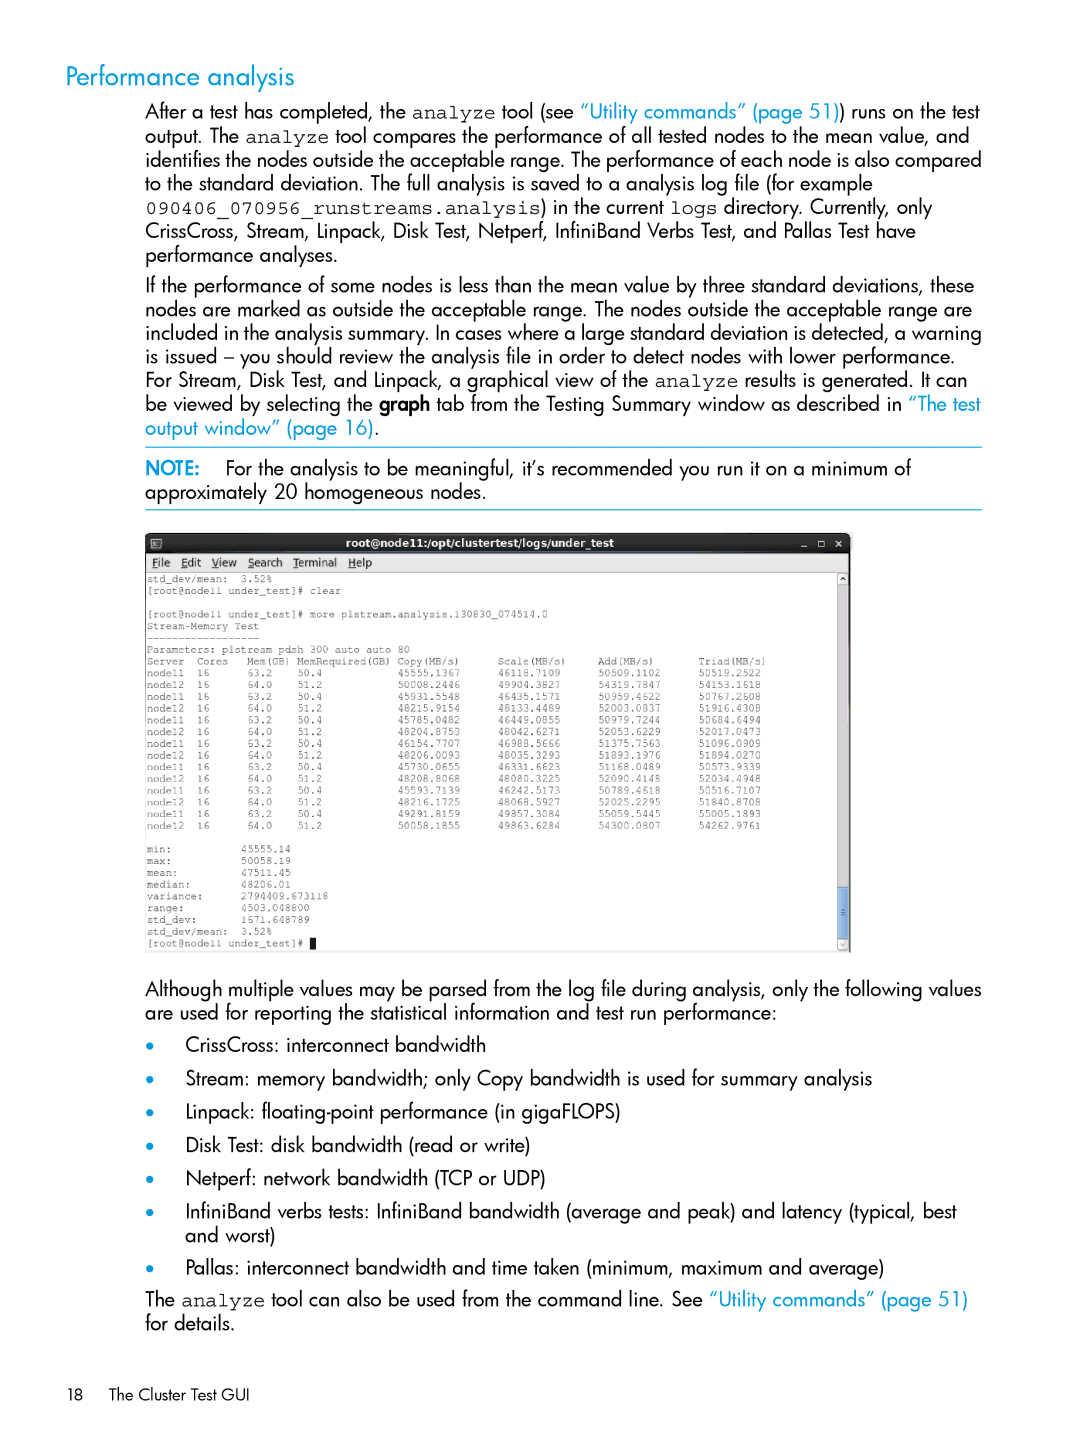
For Stream, Disk Test, and Linpack, a graphical view of the analyze results is generated. It can be viewed by selecting the graph tab from the Testing Summary window as described in “The test output window” (page 16).
NOTE: For the analysis to be meaningful, it’s recommended you run it on a minimum of approximately 20 homogeneous nodes.
Although multiple values may be parsed from the log file during analysis, only the following values are used for reporting the statistical information and test run performance:
•CrissCross: interconnect bandwidth
•Stream: memory bandwidth; only Copy bandwidth is used for summary analysis
•Linpack:
•Disk Test: disk bandwidth (read or write)
•Netperf: network bandwidth (TCP or UDP)
•InfiniBand verbs tests: InfiniBand bandwidth (average and peak) and latency (typical, best and worst)
•Pallas: interconnect bandwidth and time taken (minimum, maximum and average)
The analyze tool can also be used from the command line. See “Utility commands” (page 51) for details.