Server health check
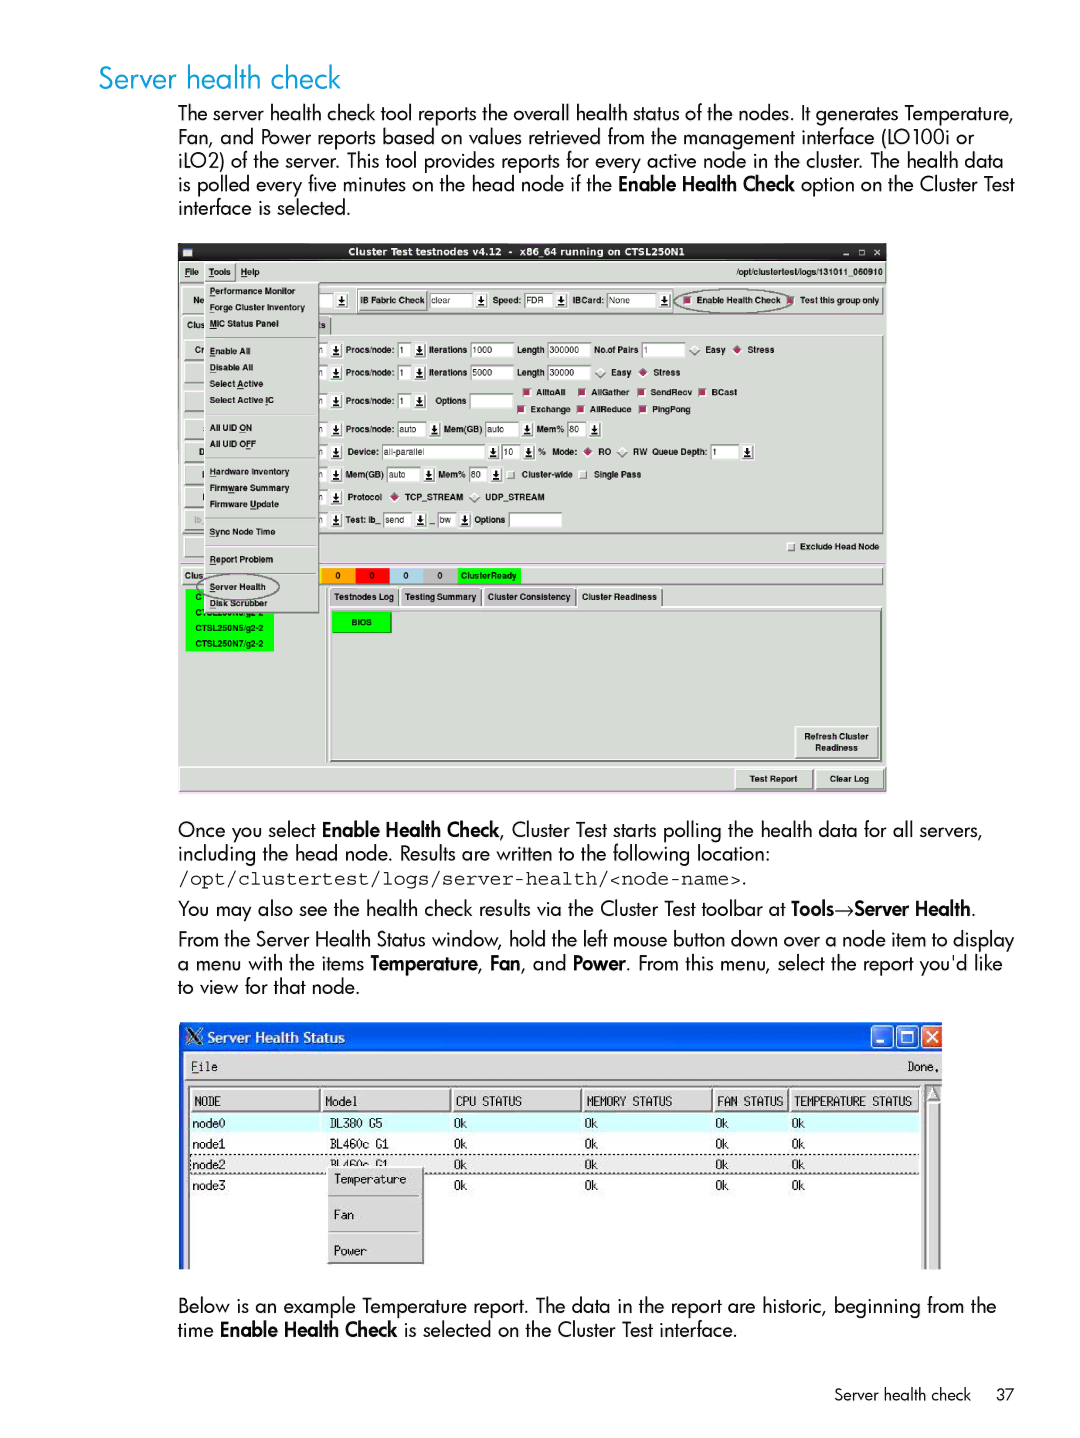
The server health check tool reports the overall health status of the nodes. It generates Temperature, Fan, and Power reports based on values retrieved from the management interface (LO100i or iLO2) of the server. This tool provides reports for every active node in the cluster. The health data is polled every five minutes on the head node if the Enable Health Check option on the Cluster Test interface is selected.
Once you select Enable Health Check, Cluster Test starts polling the health data for all servers, including the head node. Results are written to the following
You may also see the health check results via the Cluster Test toolbar at Tools→Server Health.
From the Server Health Status window, hold the left mouse button down over a node item to display a menu with the items Temperature, Fan, and Power. From this menu, select the report you'd like to view for that node.
Below is an example Temperature report. The data in the report are historic, beginning from the time Enable Health Check is selected on the Cluster Test interface.
Server health check 37
