Installing and Using Monitors
Viewing Current Monitoring Requests
Viewing Current Monitoring Requests
Before adding or modifying monitoring requests, you should examine the current monitoring requests. These include the default monitoring requests created during system startup. By examining the current requests, you can determine what additional requests may be needed to implement your monitoring and notification strategy.
The option to Show Monitoring Requests displays all the monitoring requests that have been created using the Hardware Monitoring Request Manager, even requests that are inactive. See “Checking Detailed Monitoring Status” on page 47, for information on viewing only active monitoring requests.
To view (or show) the current monitoring requests:
1.Run the Hardware Monitoring Request Manager by entering:
/etc/opt/resmon/lbin/monconfig
2.From the main menu selection prompt, enter S
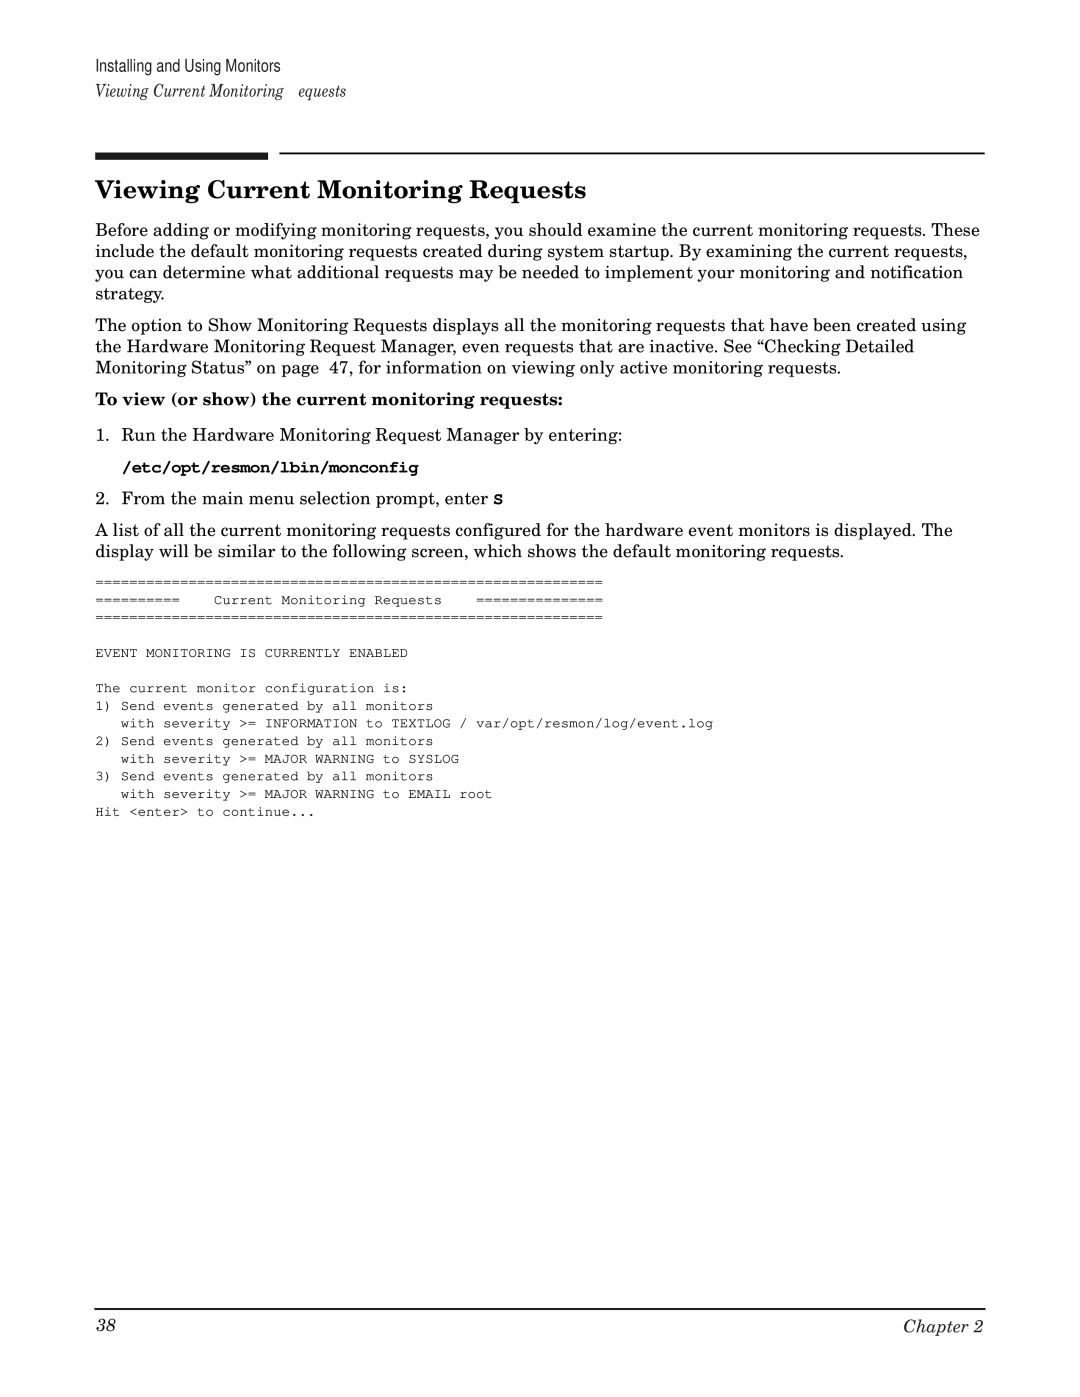
A list of all the current monitoring requests configured for the hardware event monitors is displayed. The display will be similar to the following screen, which shows the default monitoring requests.
============================================================
========== Current Monitoring Requests ===============
============================================================
EVENT MONITORING IS CURRENTLY ENABLED
The current monitor configuration is:
1)Send events generated by all monitors
with severity >= INFORMATION to TEXTLOG / var/opt/resmon/log/event.log
2)Send events generated by all monitors with severity >= MAJOR WARNING to SYSLOG
3)Send events generated by all monitors
with severity >= MAJOR WARNING to EMAIL root
Hit <enter> to continue...
38 | Chapter 2 |
