BIOS Quick Reference
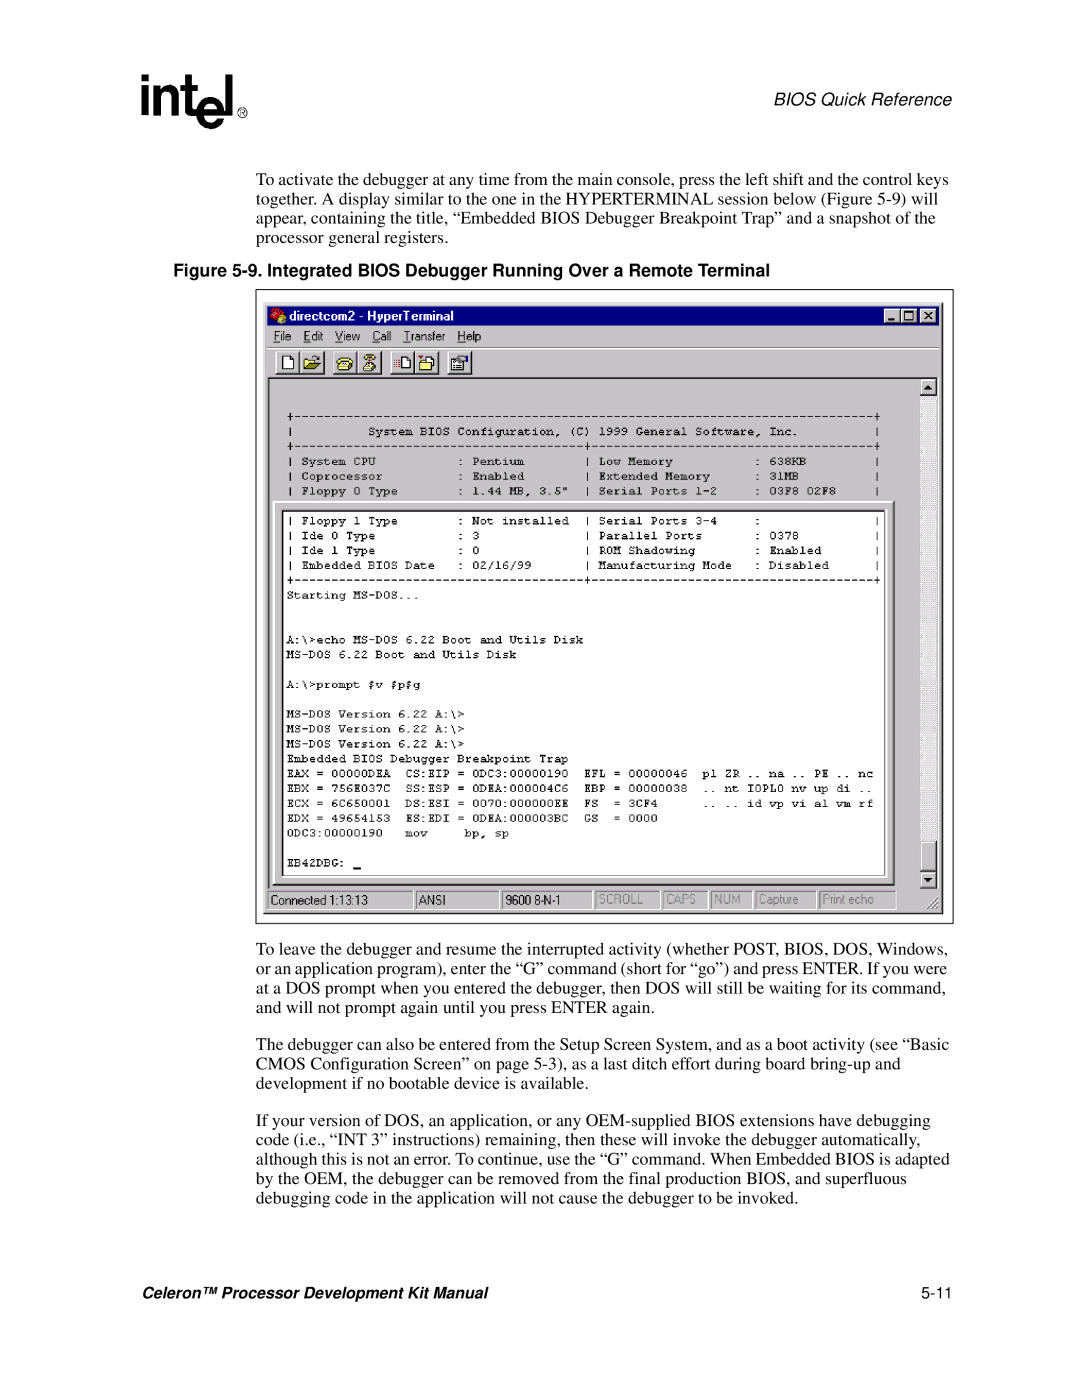
To activate the debugger at any time from the main console, press the left shift and the control keys together. A display similar to the one in the HYPERTERMINAL session below (Figure
Figure 5-9. Integrated BIOS Debugger Running Over a Remote Terminal
To leave the debugger and resume the interrupted activity (whether POST, BIOS, DOS, Windows, or an application program), enter the “G” command (short for “go”) and press ENTER. If you were at a DOS prompt when you entered the debugger, then DOS will still be waiting for its command, and will not prompt again until you press ENTER again.
The debugger can also be entered from the Setup Screen System, and as a boot activity (see “Basic CMOS Configuration Screen” on page
If your version of DOS, an application, or any
Celeron™ Processor Development Kit Manual |