Link to the Table of Contents
Table of Contents
Part 3 Diabetes Management
Part 4 OneTouch DMS Database Management 137
Part 5 Appendices 146
Part 1 Before You Begin
Welcome
Table of Contents Index
Meter Family Meters
Generate Reports
When you see this You can do this
About This Manual
Transfer meter readings, manage data,
Searching for keywords or phrases
Paging through documents
Package Contents
Meter Meter Adapter
What You Need To Get Started
Table of Contents Index
Changes to the Software
Features that were added
Features that were eliminated
Getting Technical Support
Navigating OneTouch DMS
Keyboard and Mouse Pointer Conventions
If you do this with your You can do this Mouse and keyboard
OneTouch DMS Button Behavior
When you click on this You can do this
OneTouch DMS database. The record will be
OneTouch DMS Button Behavior
This button lets you make content changes on several
Cancel any data entries from the current screen
Restore the settings to the default values
Restore one or more archived data records to
OneTouch DMS Links
Part 2 Getting Started
Installing OneTouch DMS v2.3.1 on Your PC
To install OneTouch DMS
To connect to a database
Country Selection
Table of Contents Index
If you You want to You should do this
Uninstalling OneTouch DMS v2.3.1 from your PC
Software\OneTouch Software
Starting Up OneTouch DMS
If you You can do this
Click on Start\Programs\OneTouch
Setup
Settings
Create patient profiles, and modify meter
Customizing OneTouch DMS for Personal Use
Following links appear under the 4 icons
Quick Reference Guide
When you see this You can do this
Patient Setup
General Tab
Diabetes Educator Names, and Insurance Carrier
Unknown is the default setting. You can also select
Patient Data Entry Fields
Names, Date of Birth, Gender, ID Number, Doctor
Any other Diabetes Type
Range limit. If you are using Personal Settings, you can
Target Ranges
Type 2 Diabetes
Schedule Tab
Table of Contents Index
One ends
To set meal slot times
Table of Contents Index
Are automatically assigned time slots. If you decide
Using comments/events to assign meter readings to time slots
Medications Tab
If you see this You can do this
Regimen Tab
Date Effective
Default Date
Active/Regimen List
That Regimen in the list to the left
By clicking on Other and entering a name
Complications Tab
Find a Patient Tab
Preferences
Mouse or internal modem is usually connected to
Autosearch is the default setting
If you know the correct COM port, uncheck
Autosearch and select the port COM1-COM256
If the meter is set to mmol/L units, and you select
Purposes. The units setting on the meter will not
On the down arrow in the Unit of Measure field
Menu. The unit of measure selected here will be
Important Information about Units of Measure
Displaying Units of Measure
Table of Contents Index
Plasma or whole blood, depending on
If you want to do this Then do this
Test result on the meter display. Then set
Report Options Tab
Select Favorite Report
Default Date Range
Testing order within
Sort glucose results
Data transfer
Canadian Diabetes Association
Global Targets Tab
American Diabetes Association For mg/dL locales
For mmol/L locales
Table of Contents Index
Table of Contents Index
Hypoglycemic Tab
63 mg/dL 3.5 mmol/L when using whole blood values
Threshold settings is provided
Mmol/L when using whole blood values
70 mg/dL 3.9 mmol/L when using plasma values,
Modify Meter Settings
Clock Tab
Different from the time of the PC clock
Date and Time fields that appear when this option
Match the meter clock time with the PC clock time
Set the date and time of the meter clock so that its
General Tab
Cholesterol Units
Language
Beep
To a message
Schedule Tab
After breakfast
Insulin Tab
Oral Meds Tab
Medication doses in the meter memory
Existing Medications
Already available with the meter
Types. This will make it easier to enter and record
Targets & Hypoglycemic Tab
Part 3 Diabetes Management
Download Meter Readings
Connecting a Meter to Your PC
If you are connecting one of these meters
Transferring Meter Readings
Assigning Meter Readings to the Database
Table of Contents Index
Table of Contents Index
Clear Meter Readings
You should do this
Completing the Clear Meter Readings Process
General Report Information
View and Manage Reports and Data Records
Table of Contents Index
Viewing Additional Data
Using ToolTips the hover-over feature when viewing Reports
Report Header
Statistics Panel
When you see this It means this Statistics Panel
Footnotes
Colors and Shading in Reports
Viewing Reports
Printing Reports
Logbook Report
Choose Your Report
Table of Contents Index
Sorting Data
Modifying Data
Assigning Data to a Meal Slot
Glucose Readings
Health Notes Data
Insulin Data
Carb Data
Exercise Data
Day View screen of the Logbook Report
Table of Contents Index
Glucose Trend Report
Pie Chart Report
Summary Report
Standard Day Report
Insulin Report
Health Checks Report
Table of Contents Index Previous Next 105
Average Readings Report
Exception Report
Table of Contents Index Previous Next 108
Added manually in OneTouch DMS
Data List Report
Source of Insulin Data Displayed in the Data List Report
Transferred from a meter
Table of Contents Index Previous Next 110
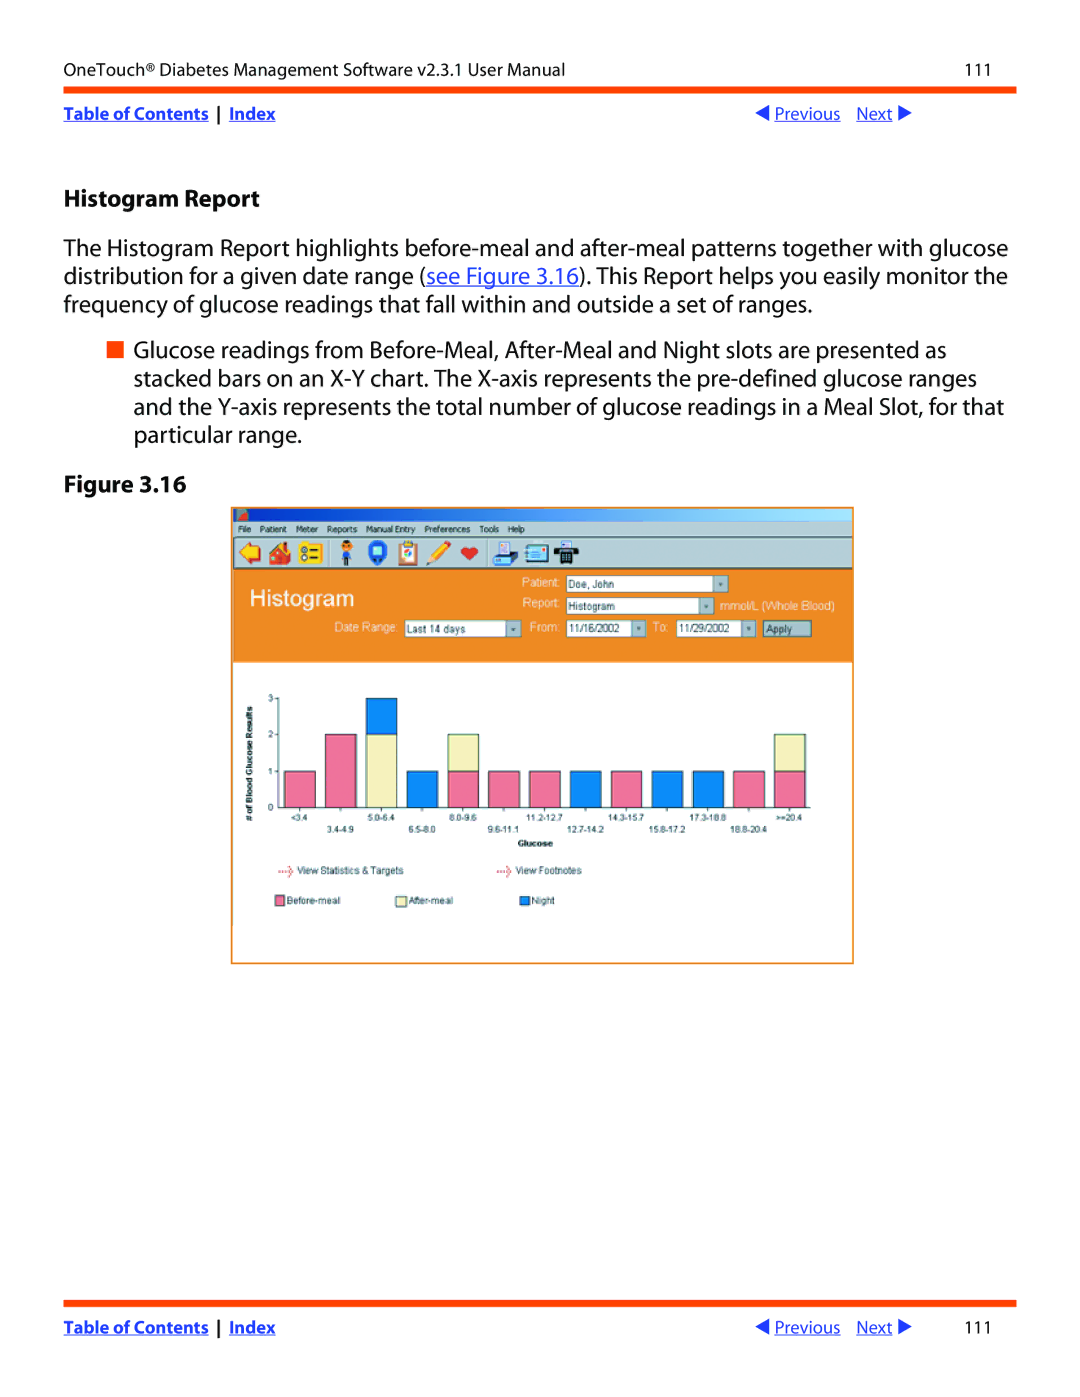
Histogram Report
To print any Report
Printing, Faxing and E-Mailing OneTouch DMS Reports
If you see this Information is Comments
To fax any Report
To e-mail any Report
Modify Data Records Edit, Omit, Restore, and Delete
You may not edit any other data values
Editing Records
If the data record Then you can edit these data values
Comments tagged to the record
Omitting Records
Restoring Records
Deleting Records
Manually Enter Data
Table of Contents Index Previous Next 119
To the Manual Entry-B screen
On the Home Screen
Manual Entry-A screen. Click on any
Exercise, and Food to enter data
Table of Contents Index Previous Next 121
Glucose Tab
Must enter a value or click on High in the check box
Unit increments for mmol/L
Glucose reading that is manually added Type
Illness
Glucose Comments
Your own words
Click on any pre-defined Glucose Comment that applies
Desired hour and minute
That appear. Then click on the up/down arrows until you find
Insulin type to the menu list, click on the Add Insulin
Patient Setup screen. If you want to add a new
Patient Setup screen where you can add new Insulin
Injection/Bolus/Pump
Table of Contents Index Previous Next 127
Comments
Medications
Exercise Tab
Desired date. Or you can click on the down
Default values
There are no default values
Modify the Date in the field by directly entering
Food Tab
Time, or by clicking on the hour or minute values
Are no default values
Time when you had a drink
Change the day, month, and year
Health Records Tab
HbA1c Specify HbA1c A1c test result as follows
Normal
Weight records. You may enter values for height
Actual value
Result type choices are
An actual value between 0 and 500 mg/dL
To 25.9 mmol/L or
Specify 1000 25.9 in mmol/L
For LDL
Part 4 OneTouch DMS Database Management
Archiving/Retrieving Data Records
Delete Readings After Archive
Archive Tab
Retrieve Tab
Click on the Examine File button to display the patient
Name of the file with the directory path as the first part
Name. You may also use the Browse function to help
Locate a file or directory
Export Tab
Exporting/Importing Data Records
Patient at a time
Import Tab
Backing Up Data
Field. Select the desired patient. You may import data
Records for only one patient at a time
Appendix D
Appendix a
Appendix B
Appendix C
Appendix a Menu Bar and Tool Bar Commands
Menu Bar Commands
Print Options
Database in this Tab
Add display the General Tab of the Patient Setup
New patient to the database in this Tab
Patient Name. You can delete a patient from
Choose Your Report
Display any of the following screens
Screen. You can add new Food Records to Database in this Tab
Glucose display the Glucose Tab of the Manual
Environment in this Tab, including
Archived data may be restored to the database
File format, where it may be used with other PC
Screen. You can customize the OneTouch DMS
When you click You can do this On this
Tool Bar Commands
Appendix B Glossary
Table of Contents Index Previous Next 154
Table of Contents Index Previous Next 155
Table of Contents Index Previous Next 156
Table of Contents Index Previous Next 157
Table of Contents Index Previous Next 158
Table of Contents Index Previous Next 159
Appendix C Troubleshooting
If you see these error You can do the following
Problems and Solutions
Meter. This feature is not available if you have
Future
Again Set the meter to the correct date and time
Appendix D Technical Support Contact Numbers
OneTouch DMS Support
Country Telephone Mail
TopicPage Number
Appendix E Index
Conversion from Whole Blood to Plasma Values
Table of Contents Index Previous Next 166
Table of Contents Index Previous Next 167
Table of Contents Index Previous Next 168
Table of Contents Index Previous Next 169
Preferences Screen, Global Target Settings
Table of Contents Index Previous Next 171
Table of Contents Index Previous Next 172
Table of Contents Index Previous 173