Section 7 | Refrigeration System |
|
|
ANALYZING SUCTION PRESSURE
DURING FREEZE CYCLE
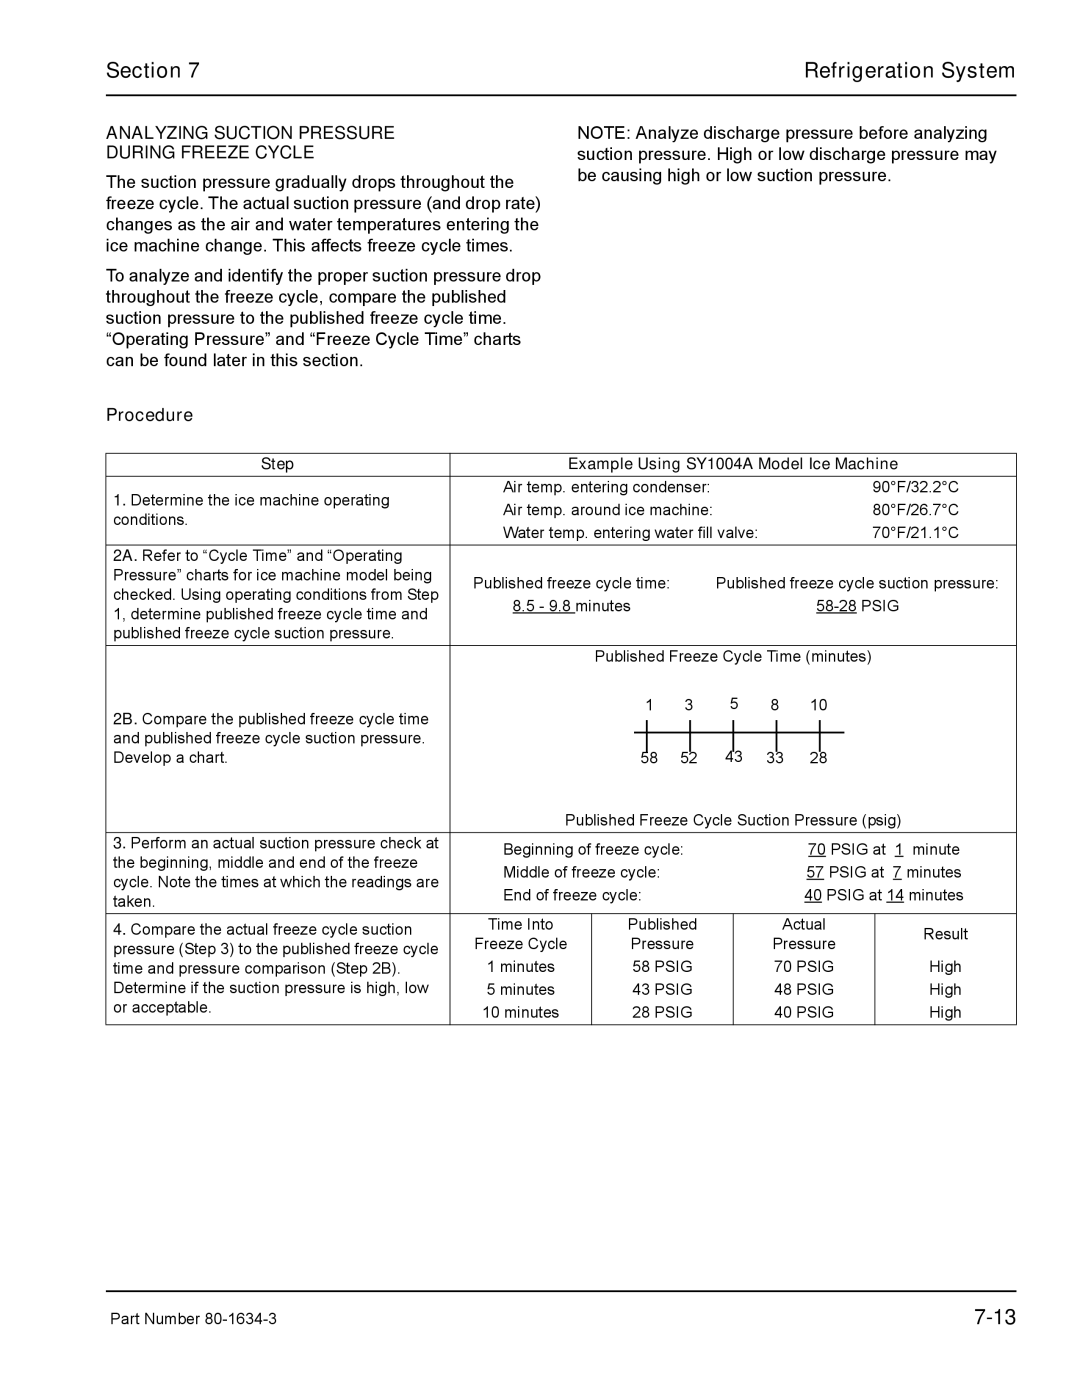
The suction pressure gradually drops throughout the freeze cycle. The actual suction pressure (and drop rate) changes as the air and water temperatures entering the ice machine change. This affects freeze cycle times.
To analyze and identify the proper suction pressure drop throughout the freeze cycle, compare the published suction pressure to the published freeze cycle time. “Operating Pressure” and “Freeze Cycle Time” charts can be found later in this section.
Procedure
NOTE: Analyze discharge pressure before analyzing suction pressure. High or low discharge pressure may be causing high or low suction pressure.
Step |
| Example Using SY1004A Model Ice Machine | ||||||||||||||
1. Determine the ice machine operating | Air temp. entering condenser: |
|
|
|
|
|
| 90°F/32.2°C | ||||||||
Air temp. around ice machine: |
|
|
|
|
|
| 80°F/26.7°C | |||||||||
conditions. |
|
|
|
|
|
| ||||||||||
Water temp. entering water fill valve: |
|
|
|
| 70°F/21.1°C | |||||||||||
|
|
|
|
| ||||||||||||
2A. Refer to “Cycle Time” and “Operating |
|
|
|
|
|
|
|
|
|
|
|
|
|
|
|
|
Pressure” charts for ice machine model being | Published freeze cycle time: |
|
| Published freeze cycle suction pressure: | ||||||||||||
checked. Using operating conditions from Step |
|
| ||||||||||||||
8.5 - 9.8 minutes |
|
|
|
|
|
| ||||||||||
1, determine published freeze cycle time and |
|
|
|
|
|
| ||||||||||
|
|
|
|
|
|
|
|
|
|
|
|
|
|
|
| |
published freeze cycle suction pressure. |
|
|
|
|
|
|
|
|
|
|
|
|
|
|
|
|
|
|
| Published Freeze Cycle Time (minutes) |
| ||||||||||||
2B. Compare the published freeze cycle time |
| 1 | 3 | 5 | 8 | 10 |
|
|
| |||||||
|
|
|
|
|
|
|
|
|
|
|
|
|
|
|
| |
|
|
|
|
|
|
|
|
|
|
|
|
|
|
|
| |
and published freeze cycle suction pressure. |
|
|
|
|
|
|
|
|
|
|
|
|
|
|
|
|
|
|
|
|
|
|
|
|
|
|
|
|
|
|
|
| |
Develop a chart. |
| 58 | 52 | 43 | 33 | 28 |
|
|
| |||||||
| Published Freeze Cycle Suction Pressure (psig) | |||||||||||||||
3. Perform an actual suction pressure check at | Beginning of freeze cycle: |
|
|
|
| 70 PSIG at | 1 minute | |||||||||
the beginning, middle and end of the freeze |
|
|
|
| ||||||||||||
Middle of freeze cycle: |
|
|
|
|
|
| 57 PSIG at | 7 minutes | ||||||||
cycle. Note the times at which the readings are |
|
|
|
|
|
| ||||||||||
End of freeze cycle: |
|
|
|
|
|
| 40 PSIG at 14 minutes | |||||||||
taken. |
|
|
|
|
|
| ||||||||||
|
|
|
|
|
|
|
|
|
|
|
|
|
|
|
| |
4. Compare the actual freeze cycle suction | Time Into |
| Published |
|
|
| Actual |
| Result | |||||||
Freeze Cycle |
| Pressure |
|
| Pressure |
| ||||||||||
pressure (Step 3) to the published freeze cycle |
|
|
|
|
| |||||||||||
1 minutes |
| 58 PSIG |
|
| 70 PSIG |
| High | |||||||||
time and pressure comparison (Step 2B). |
|
|
|
| ||||||||||||
Determine if the suction pressure is high, low | 5 minutes |
| 43 PSIG |
|
| 48 PSIG |
| High | ||||||||
or acceptable. | 10 minutes |
| 28 PSIG |
|
| 40 PSIG |
| High | ||||||||
|
|
|
|
| ||||||||||||
Part Number |