Compass User Guide
Compass User Guide
Table of Contents
Appendix a Compass Software File Locations 145
List of Figures
Page
List of Tables
Page
About this Document
Audience
Related Documentation
Documentation Updates Document Conventions
Organization
Manual Macintosh Keyboard
Be dragged to change the size of the window
Verb item on which to act Action
Data to be typed
Following symbols are used to identify important information
About Meyer Sound
Compass
Technical Support
Web Site Support Telephone Voice/Fax Support
Before Using Technical Support
Microsoft Windows
System Requirements
Mac OS
Microsoft Windows
Installing Compass and Virtual Galileo
Mac OS
Running Compass with Virtual Galileo
Start Compass
Using the Stand-Alone Virtual Galileo
Start Virtual Galileo
Running Compass with Galileo
Network Connections
Adding Galileo 616 Units to Compass
Auto-discovery Connection of Galileo 616 Units
Troubleshooting Galileo 616 Connections
Manual Connection of Galileo 616 Units
Start Here
Compass Overview
Compass Capabilities
Using Tabs
Compass Controls
Using Value Boxes
Using Selectors
Using Buttons
Using Toggles
Using Encoders
Using Parametric EQ Handles
Using Faders
Using Meters
Using TruShaping EQ Bars
Using the File Selector
Configure Galileo
General Workflow
Label Galileos, Inputs, and Outputs
Routing
Initial Gains
Link Groups
Atmospheric Correction and Array Correction
Connect SIM3
Create Project and Snapshots
Configure Processing
Restrict Access
Compass User Guide
Page
Using Compass Tools
Navigating the Tabbed Window Interface
Using Shortcuts
Linking Settings Between Stereo Pairs
Linking Settings for All Channels on a Galileo Unit
Isolating a Single Channel
Setting Full Attenuation Gain Values
Automatic Negative Gain Values
Arithmetic in Gain Value Controls
Rapid Fader Values Changes with the Mouse
Setting Compass and Channel Preferences
Setting Frequency Values
Tabbing Between Input Boxes
Tabbing Between All Controls
Using Small Screen Scaling
Retain Meter Clipping Indicator
Viewing Full-Screen Compass
Show Meter Values on Meters
Configuring Audio Inputs and Outputs
Clear Selected Channels on Galileo Switching
Change Linked Gain Controls by Relative Amounts
Include Isolated Channels in Channel Linking
Configuring the Galileo 616 Audio Outputs
Configuring the Galileo 616 for Analog Audio Input
Select the Galileo Unit Settings Input and Output
Using the Summing Matrix
Configuring Many Galileos Simultaneously
Select a Linked Galileo Unit Settings Input and Output
Using the Summing Matrix as a Signal Router
Resetting Matrix Values
Creating a Custom Summing Matrix
Pasting or Loading Matrix Values
Using a Factory Preset Matrix
Copying or Saving Matrix Values
Compass User Guide
2x4 + 2x2 + 2x2.galileoSummingMatrix
2x4 + 2x4.galileoSummingMatrix
2x6 + 2x2.galileoSummingMatrix
2x6 + 4.galileoSummingMatrix
2x8.galileoSummingMatrix
GalileoSummingMatrix
Diagonal.galileoSummingMatrix
All Off.galileoSummingMatrix
Linking Channels
Linking Arbitrary Channels via Select
Select the Compass Channel Linking Preferences
Select the Galileo Unit Settings Link Groups
Selecting Many Channels Simultaneously Link Groups
Separating Select and Link Group Behaviors
Quickly See Which Channels Are Linked
Select the Compass Channel Linking Preferences
Choosing Selected-Channel Link Mode
Set Global Galileo Select-Linking Mode
Linking Galileos
Linking Galileo Units
Atmospheric Correction
Choosing Isolated Channel Link Mode Behavior
Atmospheric Correction and M Series Array Correction
Setting Environment Conditions for a Single Galileo Unit
Select the Galileo Unit Settings Environment
Setting Loudspeaker Distance for a Single Channel
Select the Galileo Unit Output Processing Channel Settings
Select the Output Processing Channel Settings
Series Line Array Correction
Configuring M Series Array Correction
Select the Galileo Unit Settings Array Correction
Connecting and Configuring for use with SIM3
Galileo Unit Settings Array Correction
Configuring MSL-4 Loudspeaker Array Correction
Assigning M Series Array Correction to an Output Channel
Select the SIM3 Output Probe Point
Configuring Galileo for SIM3
Select Galileo Unit Settings SIM3
Using Signal Processing
Selecting Channels
Customizing the Display
Maximizing the EQ Plot Area
Screen-splitting the Processing Window
Displaying Multiple EQ Plots
Setting Parametric EQ Values
Displaying EQ Plot Control Handles
Viewing EQ Plots With/Without Composite Addition
Parametric EQ
Setting TruShaping EQ Values
Stacking EQ Handles for Composite EQ
Viewing Exact Plot Values
TruShaping EQ
Graphic EQ
Using VX-1 Mode
Setting Graphic EQ Values
Subwoofer Filtering
Using Low Pass Filtering
Delay
Copy, Paste, Load, Save, and Reset Control Values
Delay Units and Ranges
Copy/Reset Processing Control Values
Copy/Reset an Individual Channel Control Value
Copy/Reset Summing Matrix Control Values
Saving and Loading Projects and Snapshots
Copy/Reset All Control Values of an Input or Output Channel
Copy/Reset All Control Values of an Galileo Unit
Snapshots
Creating a Snapshot
Recalling a Boot Snapshot at Galileo Power-on
Snapshot Library box, enable Is Boot
Updating a Snapshot
Locking a Snapshot
Loading a Snapshot
Using Snapshots in Static Facilities
Saving a Snapshot
Saving a Project
Using Snapshots for Tour Setup
Creating a New Project Select the Galileo Unit Project
Creating Project Backups Select the Galileo Unit Project
Loading a Project Select the Galileo Unit Project
Current Project box, click Open…
Merging Projects
Creating a Project Report
Restricting Access to Compass Settings
Locking Galileo Controls Select Galileo Unit Settings Access
Click Clear Access Control
Recovering a Lost Access Password
Page
Compass Tab
Compass Preferences
General Options
User Interface Display and Control Options
Value Controller Type
Input Device Type
Color Mode
Typed in Decibel dB Values Default to Negative
Disable Keyboard Control of Buttons
Select All Text When Entering Text Field
Startup Galileo Discovery and Connection Options
Clip Indicator Clear Mode
Channel Linking Preferences
Link Groups and Selects Mode
De-select all channels when the active Galileo tab changes
Gain Control Linking Mode
Global Galileo Select-Linking Mode
Isolate Linking Behavior
Galileo
User Interface Reference
Galileo Galileo Galileo
Δ1 Δ1 Δ1 Δ2 Δ2 Δ2 Δ4 Δ4 Δ4 Δ5 Δ5 Δ5
Isolate Mode
Enable global linking of isolated channels
Disable global linking of isolated channels
System Settings Enable Linking Across Selected Galileos
Input and Output Settings
SIM3 Settings
Environment
Series Array Correction
Galileos Tab
Galileo 616 List Control
Find Galileos
Refresh Status
Global Project
Settings
Open
IP Address, Galileo Nickname, Tab Name, Status
Project
Upload Projects
Save
IP Address, Galileo Nickname, Tab Name
Include in Global Project
Global Snapshot
Update
Create New
Available Global Snapshots
Refresh
Known Galileos List
Named Galileo Tabs
Global Atmospheric Correction Control
Boot Snapshot Disabled/Boot Snapshot Enabled
Save Project
Create
Select
Link Group
Status Lights
Not Modified / Modified
Active Snapshot
ID, Name, Comment
User / Factory
Current Project
Name, Description
Modified
Update Notes
Backup Project
Load Galileo Settings
More / Less
Boot Snapshot
Clear ‘Is Boot’
Name
Snapshot Library
Update Selected
Is Boot
Locked / Unlocked
User
Paste
Load
Upload Firmware
Network
Galileo Device Type, Galileo Device Nickname, IP Address
Galileo I/O Settings
Input and Output
Output Voltage Range +26 dBu / +20 dBu
Input Channel Types
Input Voltage Range
SIM3
SIM3 Bus Address
SIM3 Trim Disabled / SIM3 Trim Enabled
Output Post Delay
SIM3 Output Probe Point
Output Post Gain
Temperature C or F
Environment
Access
Atmospheric Correction Distance Linked
Access Code Entry
Access Restrictions
Array Correction
Array Name
Status
Type
Size
Array Correction Output Assignments
Group Name
Link Groups
Link Group Input Assignments
Channels 1−16
Channels A−F
Link Group Output Assignments
Galileo Map
Inputs Rows
Label
Meter
Mute
Gain
Outputs Rows
117
Galileo Map Control
Sets the altitude for the venue
Input Processing
Channel Selection
Input Channel
Channel Buttons
Plot Curve
Sel / Iso / Link
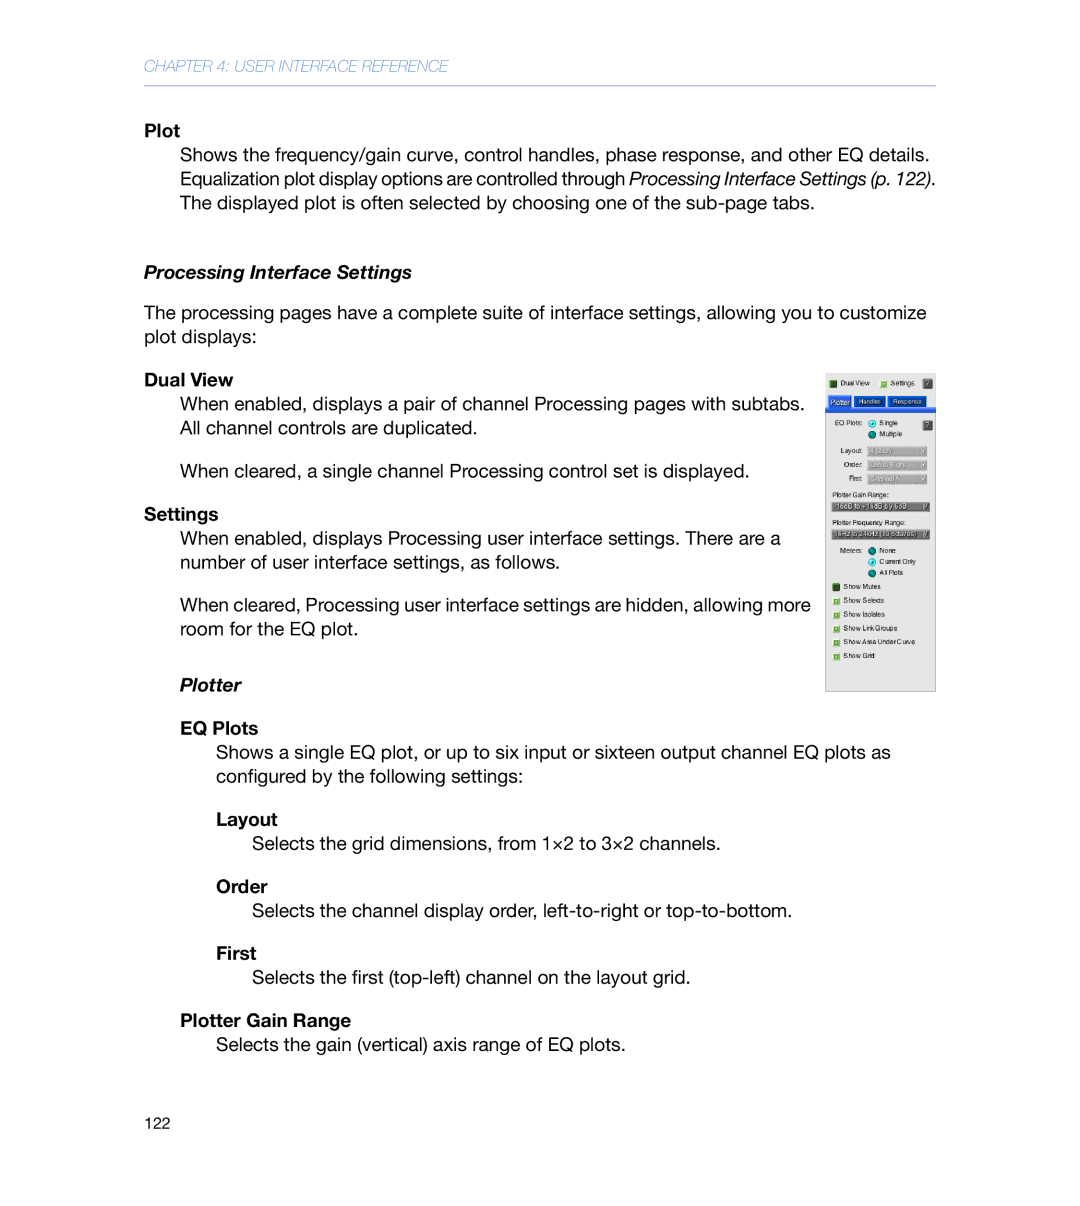
Processing Interface Settings
Plotter
Handles
Response
Channel Settings
Parametric Enabled / Parametric Bypassed
TruShaping Enabled / TruShaping Bypassed
Graphic EQ Enabled / Graphic EQ Bypassed
Freq
−5 Enabled / 1−5 Bypassed
Parametric
TruShaping
TruShaping Enabled / TruShaping Disabled
VX-1 Mode
Graphic EQ
Output Processing
Output Channel
130
Output Processing Interface Settings
Atmospheric Correction Distance
SIM3 Trim
High/Low Pass Filtering
−10 Enabled / 1−10 Bypassed
134
Router Mode
Matrix
Processing Shortcut
Input Masters
Channel Label
Fader
Output Masters
Displays the appropriate Output Processing
Setting
Additional User Interface Details
Right-click Copy
Control group
Reset
Cancel
Paste control / Paste control set / Paste control
Copy control / Copy channel / Copy control set
Keyboard Modifiers and Shortcuts
Colors
Tab Colors
Background Colors
Channel Colors
Dark Blue light blue
Page
Project Backups
Appendix a Compass Software File Locations
Factory Presets
Meyer Sound LD-2 Line Driver
Appendix B Network Information
Virtual Galileo
Page
High-Frequency Equalization Strategies
Low-Frequency Equalization Strategies
Example Curves
Simple Flat Response Curve
Figure C.1. Single Milo at 4 meters
High-Frequency Response Curves
Figure C.3. Corrected Eight Milo Array at 60M
Low-Frequency Response Curves
Figure C.4. Corrected Eight Milo Array at Various Distances
Combined Response Curves
Figure C.5. Corrected Milo Arrays of Differing Sizes
Figure C.6. Corrected Eight Milo Array at Various Distances
Index
Index
159
Linking control value adjustments, 24 Subwoofer Filtering