Monitoring Performance 41
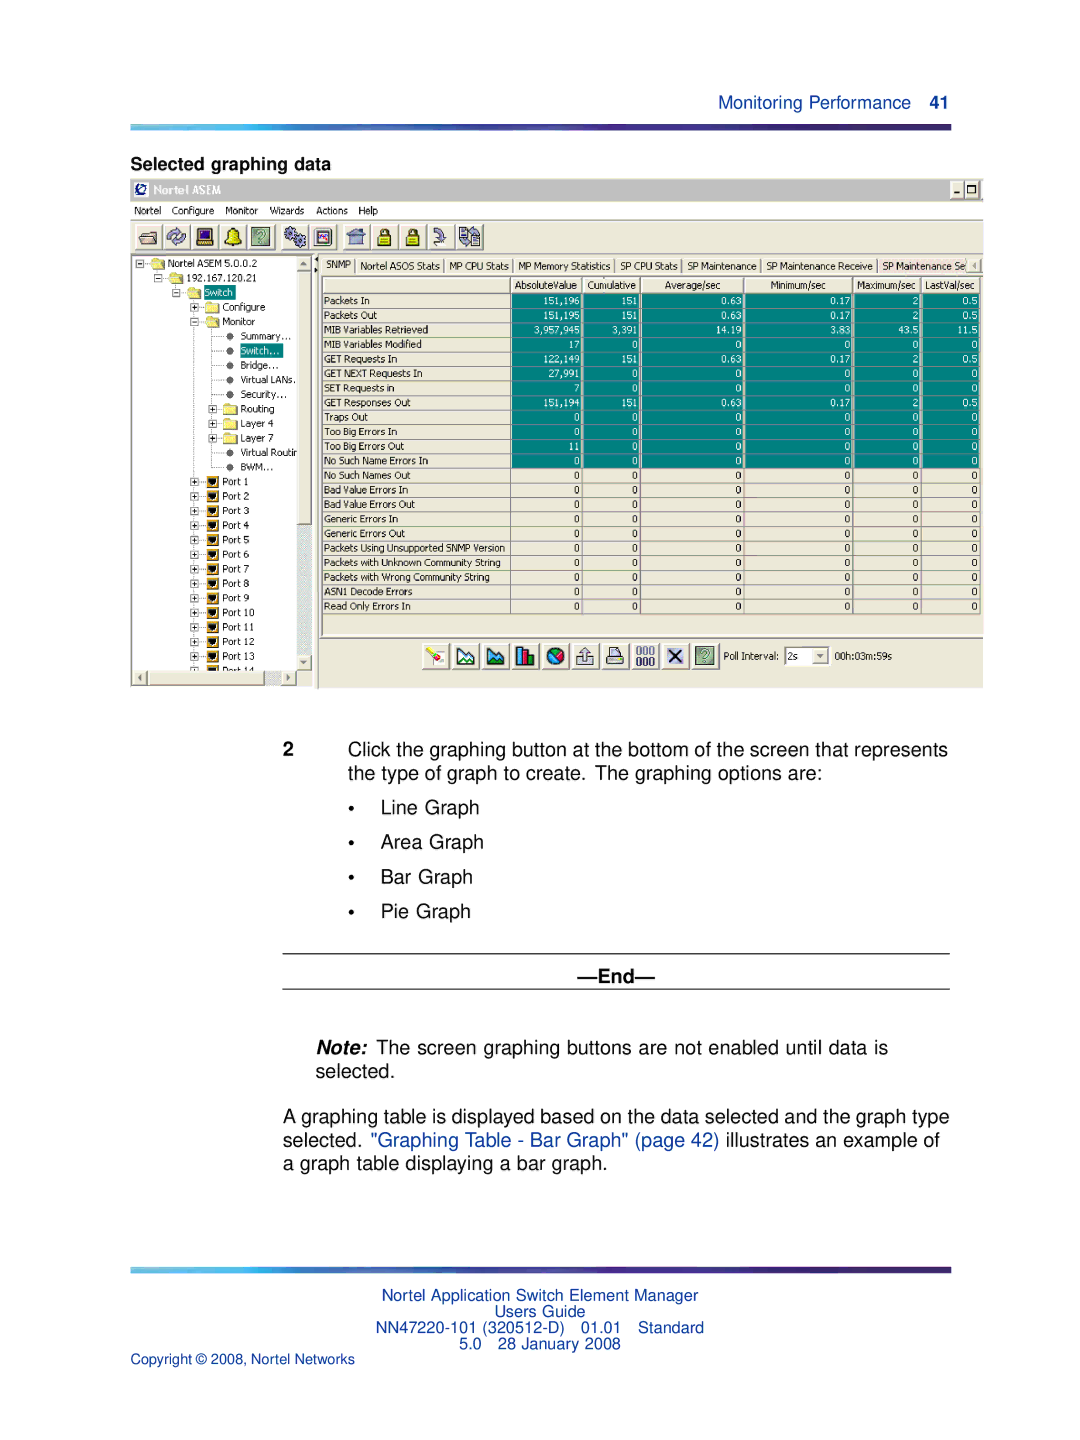
Selected graphing data
2Click the graphing button at the bottom of the screen that represents the type of graph to create. The graphing options are:
•Line Graph
•Area Graph
•Bar Graph
•Pie Graph
—End—
Note: The screen graphing buttons are not enabled until data is selected.
A graphing table is displayed based on the data selected and the graph type selected. "Graphing Table - Bar Graph" (page 42) illustrates an example of a graph table displaying a bar graph.
Nortel Application Switch Element Manager
Users Guide
5.0 28 January 2008
Copyright © 2008, Nortel Networks