11/2007
Zelio Logic Smart Relay
Table of Contents
Transfer Menu
Configuration Menu
Default Menu
Clear Program Menu
Sample Application
Diagnostics
Implementing a Basic Application
Debugging an Application
Important Information
Safety Information
Safety Information
At a Glance
About the Book
Initial Power up and Discovering
Chapter Name Initial Power up and Discovering
Presentation
Topic
Subject of this Chapter Whats in this Chapter?
Preliminary Advice
Safety
Risk of Electric SHOCK, Explosion or Electric Arcing
Involuntary Operation of Equipment
Presentation of the Smart Relay Front Panel
U 2 5 S E P 1 6 4
Introduction Description Smart Relay Front Panel
Description of the LCD
An Active input or output is displayed in reverse video
Prompt Element
Characteristics and Connections
Regulated
Rectified and filtered
Menu/OK Key
Control Keys on the Front Panel of the Smart Relay
N / S T O P
Shift Key
Navigation keys are used to move left or right, down or up
Round for a link only in programming mode
Zx Keys
Are marked above the keys
Using the contextual menu functions
Contextual
Menus Contextual menu appears Illustration Ins + Param Del
View
Examples
Introduction Language Selection
Step Action
E a R P R O G A N S F E R R S I O N N G U a G E
Or then
D E O P
Then Times in LD mode
Modification of Date and Hour
View A N G E D / H U L 2 0 0 2 7 3 0 s Secs / WK
View 3 4 B C D E
Functions Accessible from the Front Panel
Subject of this Section Whats in this Part?
Chapter Chapter Name
Overview of the Functions Accessible from the Front Panel
Line flashes to indicate where you are positioned
To return to the previous menu, press left navigation key
Extensions
Certain menus are specific to either LD or FBD mode
Configuring
Differences Between LD FBD Modes
Input/Output Screen
N 2 2 S E P 1 5 5
Programming type LD or FBD Mode Stop or RUN
Inputs-Outputs Screen
3 4 5
Main Menu
Access to
T e 1 1 / 2 0 0
Switching Between Screens
Text and Display screen
L u e c o u n t e r
Result Param is displayed at the bottom of the screen
Press the Shift key white key to display the contextual menu
Subject of this Chapter
Programming Menu
Chapter?
Rules for Entering Ladder Diagrams
Smart relay allows you to enter 120 line Ladder diagrams
Following manner
Rules Incorrect Correct
M1----I4-I5-I6-Q1
Method for Entering a Contact or Coil
Description Entering an Element
Ins Del
Modifying an element Initialization Deleting an Element
Steps 7 to 9 are only necessary when entering a coil
Description Entering a Link
Entering a Link
Deleting a Link Replacing a Link with a Contact
Entry of Function Block Parameters
Description Accessibility of parameters
To modify the parameters of an existing element, simply
Entering Parameters on Creation of the Block
Ins. + Param Del
Modifying Parameters Existing Blocks
Deletion and Insertion of Diagram Lines
Deletion
Insertion
LD mode
Parameters Menu
Parameters menu
RUN Mode
FBD mode Parameter Modification
Monitoring Menu
To modify the parameters, proceed as follows
RUN/STOP Menu
Startup
Following three choices for starting the program
Off Smart Relays Without Screen
O P
Configuration Menu
Password to perform certain operations
Password Menu
Removing
Entering Password
Password
E a R 1
3 0 M I N U T E S
E a R 2
Fast
Filter Menu
Description Filter-Type Selection
Filtering Commutation Response time Slow
Zx Keys Menu
Description Zx Keys in RUN Mode
Illustration C L E = 0 5 x 0 2 m S
Watchdog Cycle Menu
Actions Cycle Time Watchdog Configuration
Clear Program Menu
Clear Prog Menu
Description Clearing the Program
Transfer Menu
L I O M E M O R Y
M O R Y Z E L I O
Module → Backup Memory Transfer
RUN, remove the Eeprom cartridge SR2 MEM02
Backup Memory → Module Transfer
With firmware on
Absence of backup memory
Application
Incompatible
MEM02
Use of SR2 MEM01 and SR2
R M W a R E 0 1
Version Menu
D U L E S R 3 B 2 6 1 B D
R D W a R E 0 1
1 4 1 B D
A L I a N O
Language Menu
Reset to Zero of the Fault Counter Illustration
Default Menu
Fault Menu
Fault 0 0
Fault Types
Default Menu
A N G E
Change DATE/TIME Menu
Clock Configuration
Example
Steps Description
Smart relays with a clock
Change SUMMER/WINTER Menu
To configure automatic time change, proceed as follows
Configuration of the Time Change
Chapter Chapter Name LD Language Elements
LD Language
LD Language Elements
Composition
Ladder Diagrams
Diagram Panel of a smart relay
Introduction
Use as a Contact
Normally open mode
Normally closed mode
Discrete Inputs
Modification
State of a
Contact
Zx Keys
Normally open mode direct state is inactive
Normally closed mode reverse state is active
Place the mouse over the letter representing the contact
Auxiliary Relays
They can be used as internal variables
Contact
Unlatch mode
Contactor mode
Impulse relay mode
Latch mode
Normally open mode
Following inputs I1, I2, I3, I4, I5 and IB
Modifying the Mode of a Coil or a Contact
Window
Latching
Initialization
Activated
Smart relay and any extensions
Discrete Discr Outputs
SQ1
Window associated with the output
Timers
Reset input
Coil TT Command Input
Coil RC Reset Input
Command input
Type of timer
Parameter lock
Preset value
Unit Symbol Form Maximum value
Time unit
Time unit
Command input timing diagram
Timer type
Number Parameter Description
Active, control held down type a
Following diagram shows the operation of the type a timer
Off delay type C
Following diagram shows the operation of the type C timer
Combination of a and C
On pulse one shot type B
Timing after pulse type W
Flasher unit, Press to start/stop, Synchronous type d
Following diagram shows the operation of the type D timer
Following diagram shows the operation of the type L timer
Flasher unit, control held down synchronously type D
Current values is are zeros
Following diagram shows the operation of the type T timer
Normally closed mode inverse state is active
Time on addition type T
Preset value t Illustration Timers configuration screen
Coil DC Counting Direction input
Coil RC Reset Initial Counter State Input
Counters
Coil CC Counting Pulse Input
Reset Initial Counter State input
Every time key Z1 is pressed, the counter starts from
Counting direction input
Contact is conducting as long as
Type of counting
Number Parameter Description Command input
Counter reset input timing diagram
Counter output Counter output timing diagram
Initialization R Counting
Mode toward the preset value
Current value is zero
Examples
Fast Counter
Coil TK1 Enable function input
Coil RK1 Reset initial counter state input
Enable function input
120
Symbol of the Duration of pulse parameter
Cycle type
Duration of pulse
Symbol of the Parameter Lock parameter Verrouillé
Value Counter reset to its initial state
Current Counter
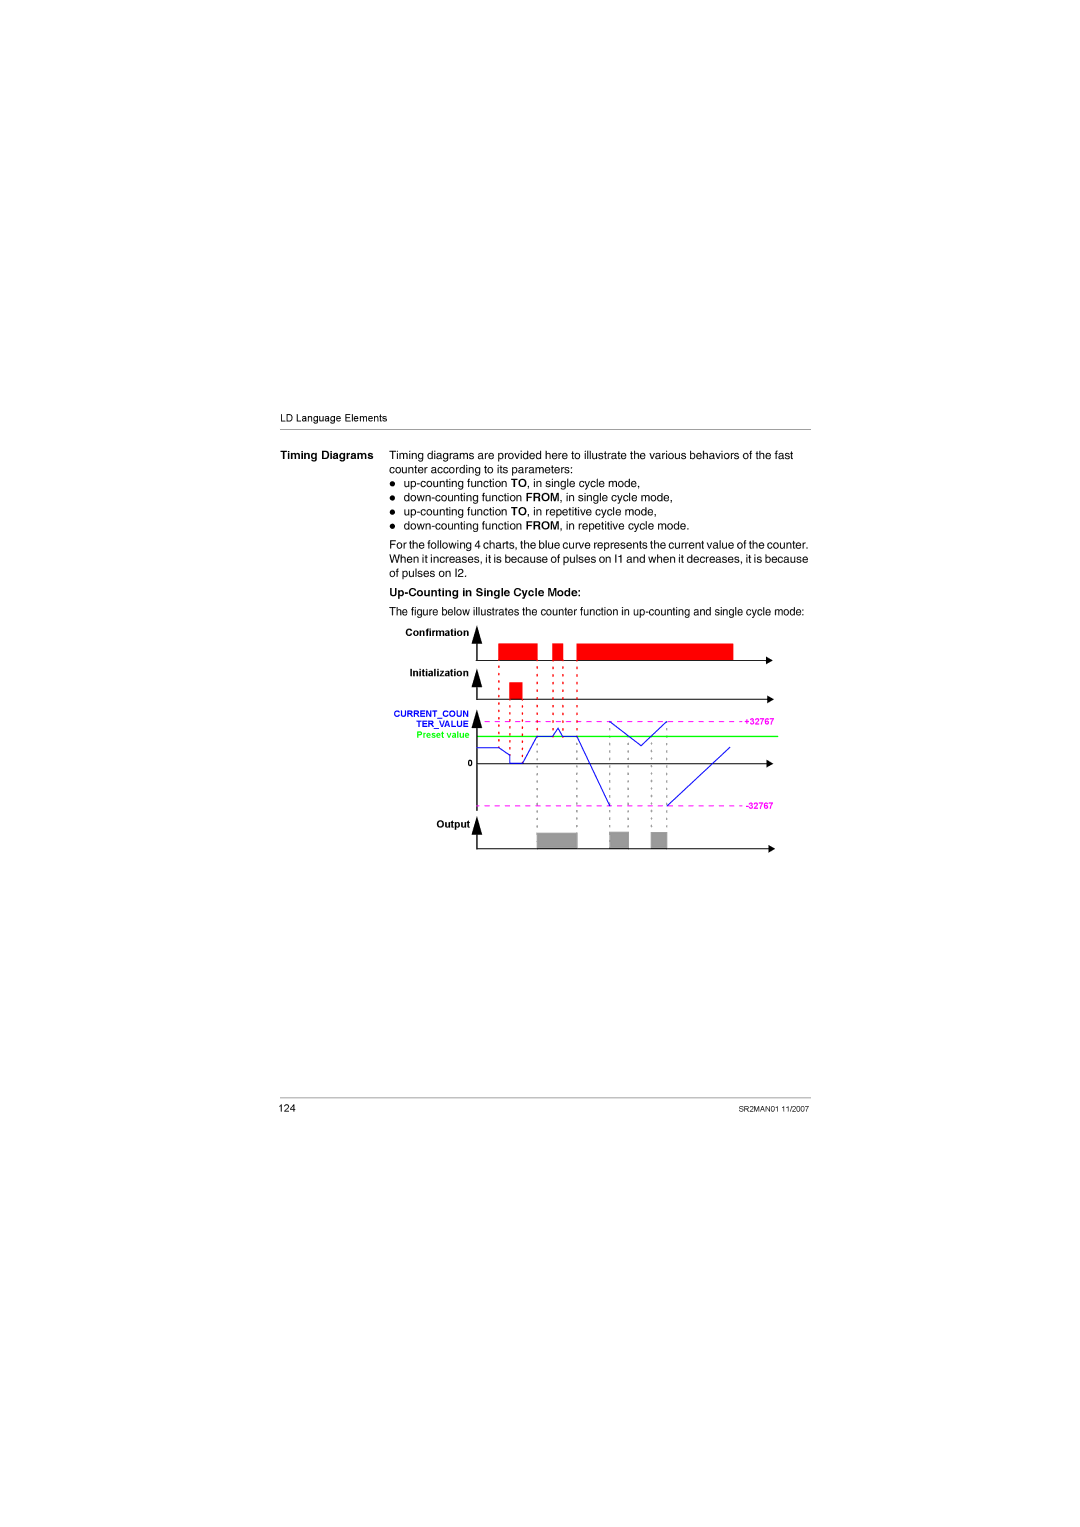
Number Parameter Description Cycle type Single/Repetitive
Up-Counting in Single Cycle Mode
Up-counting in Repetitive Cycle Mode
Down-Counting in Single Cycle Mode
Down-Counting in Repetitive Cycle Mode
TK1 RK1
Counter Comparators
Analog Comparators
Values to compare
Configuration from Front Panel
Xl Comparison Operator
X1 H ≤ x2≤ x1 + H
Reference value
Hysteresis parameter
Parameter locking
N a L O G ≤ x = I d = I e
N a L O G
≤ ξ 2 ≤ x 1 + H
= 4 = R = 1 = I e
Comparison operator no is chosen, that is ≤
Temperature is below 20 C
Clocks
Mode or its inverse state mode normally closed, see below
Symbol of the normally open contact, representing a clock
Symbol of the normally closed contact, representing a clock
Operating ranges
D / W O N O F F
Relay
Number Parameter
Interval Start on Friday at End on Monday at
Day at
2 3
2 3 4
Display from the Text screen to the inputs-outputs screen
Texts
These function blocks are used as coils
Only the block with the highest number is displayed
Display Activation coil Display Deactivation coil
Display Activation
Display deactivation
Used as a Coil
LCD Screen Backlighting
Access
Change to Summer / Winter Time
Check the Activate Summer/Winter Time Change box
Europe Europe
Modifying the Mode of a Coil or a Contact Initialization
Modbus Inputs/Outputs
Smart relay
Words sent by the master
Message
Use of the Coil Command input
Configuration from the Front Panel Initialization
Creating and Debugging an Application
Implementing a Basic Application
Presentation of Ladder Diagrams
Works a two-way switch
Normal electrical diagram Ladder diagram
Module Wiring Below, an illustration of smart relay wiring
Operation Can be used in place of two position switches
Mon
Input I wired on the smart relay
Using the Reverse Function
Electrical diagram Connection to the smart relay
Ladder diagram 1 Light off when idle
Practical Example
Off delay Operating Electrical diagram
Electrical symbol Ladder symbol
Notation Used by the Smart Relay
Equivalencies Between Notations
156
Application Implementing a Two-way Switch
Description Go to the Programming Screen
Step Action Screen Comment
To enter the contacts in the first line, proceed as follows
Entering Contacts First Line
Step Action Screen
Fois
Entering the Coil and Joining it to the Contacts
To enter the contacts in the second line, proceed as follows
Entering Contacts Second Line
Flashes
Joining the Second Line to the First
To join the second line to the first, proceed as follows
Second 1 in the second line
Launching the Program
To launch the program, proceed as follows
Programming is selected
Debugging an Application
N L D
Module in RUN Mode Viewing Status
Menus RUN mode
Dynamic Mode Ladder Diagrams
Viewing Ladder Diagrams
Changing Ladder Diagrams
3 4 5 N 2 2 S E P 1 5 5
Using Z Keys as Pushbuttons
Dynamic Mode Function Block Parameters
Accessing
Presentation
Dynamic Mode Menus
Dynamic Mode
Menus Not. Here is a summary table
Smart Relay Reaction to a Power Failure
Event of a power failure
Option defined in the parameters window
Safety Mode
With the clock function block 1 configured as follows
Example of a non-locked coil
This allows
Backup and Transfer of Ladder Diagrams19
Saving and Transferring Ladder Diagrams
Memory optional and vice-versa
Sample Application
Specifications
Outputs
Specification Analysis
Inputs
Button
Smart relay label Name
Special function blocks
Description Implementing Ladder Diagram
Implementing the Solution
Function Blocks
O F F 1 2 0
Fan operating duration if the CO
Function block Comment Analog function block A1
Compares the measured CO 2 level
With the threshold value 8.5
Chapter Name Diagnostics 187
Diagnostics
Smart Relay Messages 188 Frequently Asked Questions 189
Relay, their possible causes and how to remedy the problem
Smart Relay Messages
Message Cause Corrective action
Questions are listed here
Frequently Asked Questions
Frequently
Asked Questions
Answer
Appendix?
Appendices
This section contains product-related appendices
Appendix contains the following chapters
Compatibility
Subject of this
Chapter
Version
Smart relay firmware version
Memory cartridge
Memory Cartridge to Smart Relay
Type of memory cartridge Version of firmware compatible
Smart relay firmware language
Index
Change DATE/TIME Change SUMMER/WINTER, 83 Clear Prog
Menu
35007143