(ESC) “*” specifies the graphics mode, the CHR$(O) specifies normal density. Other densities are described later. Any number of graphics data may follow; the nl and n2 specify the number of bytes.
To figure the value of nl and n2, you need to work out how wide your image will be. Because you are limited to the largest number that can be sent in one byte (255), the formula to work out nl and n2 is:
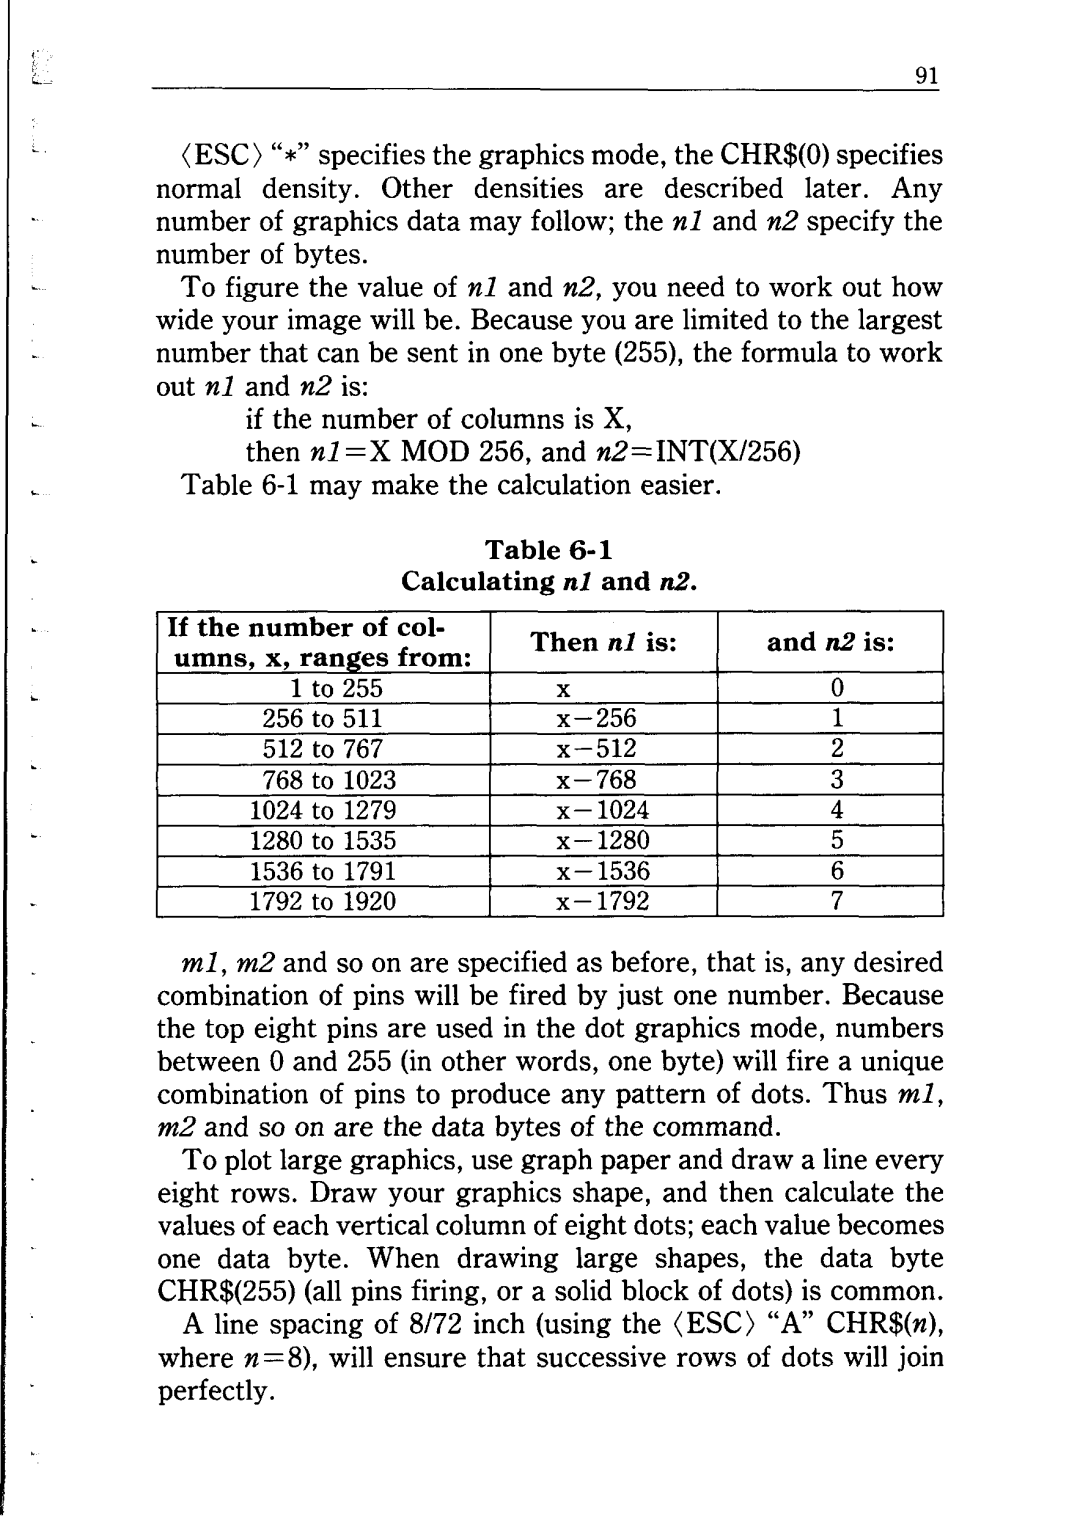
if the number of columns is X,
then nl =X MOD 256, and nZ=INT(X/256) Table
|
| Table |
|
| |
|
| Calculating | nl and n2. |
|
|
umber of col- 1 Then nl is: | and n2 is: |
| |||
|
|
| I | I | |
|
|
|
| ||
L |
|
|
|
|
|
512 | to 767 | X- |
|
| |
768 | to 1023 |
|
| ||
|
| t |
|
|
|
1536 | to | 1791 | X- |
|
|
1792 | to | 1920 |
|
|
|
ml, m2 and so on are specified as before, that is, any desired combination of pins will be fired by just one number. Because the top eight pins are used in the dot graphics mode, numbers between 0 and 255 (in other words, one byte) will fire a unique combination of pins to produce any pattern of dots. Thus ml, mZ and so on are the data bytes of the command.
To plot large graphics, use graph paper and draw a line every eight rows. Draw your graphics shape, and then calculate the values of each vertical column of eight dots; each value becomes one data byte. When drawing large shapes, the data byte CHR$(255) (all pins firing, or a solid block of dots) is common.
A line spacing of 8172 inch (using the (ESC) “A” CHR$(n), where n =8), will ensure that successive rows of dots will join perfectly.