HIGHER RESOLUTION GRAPHICS
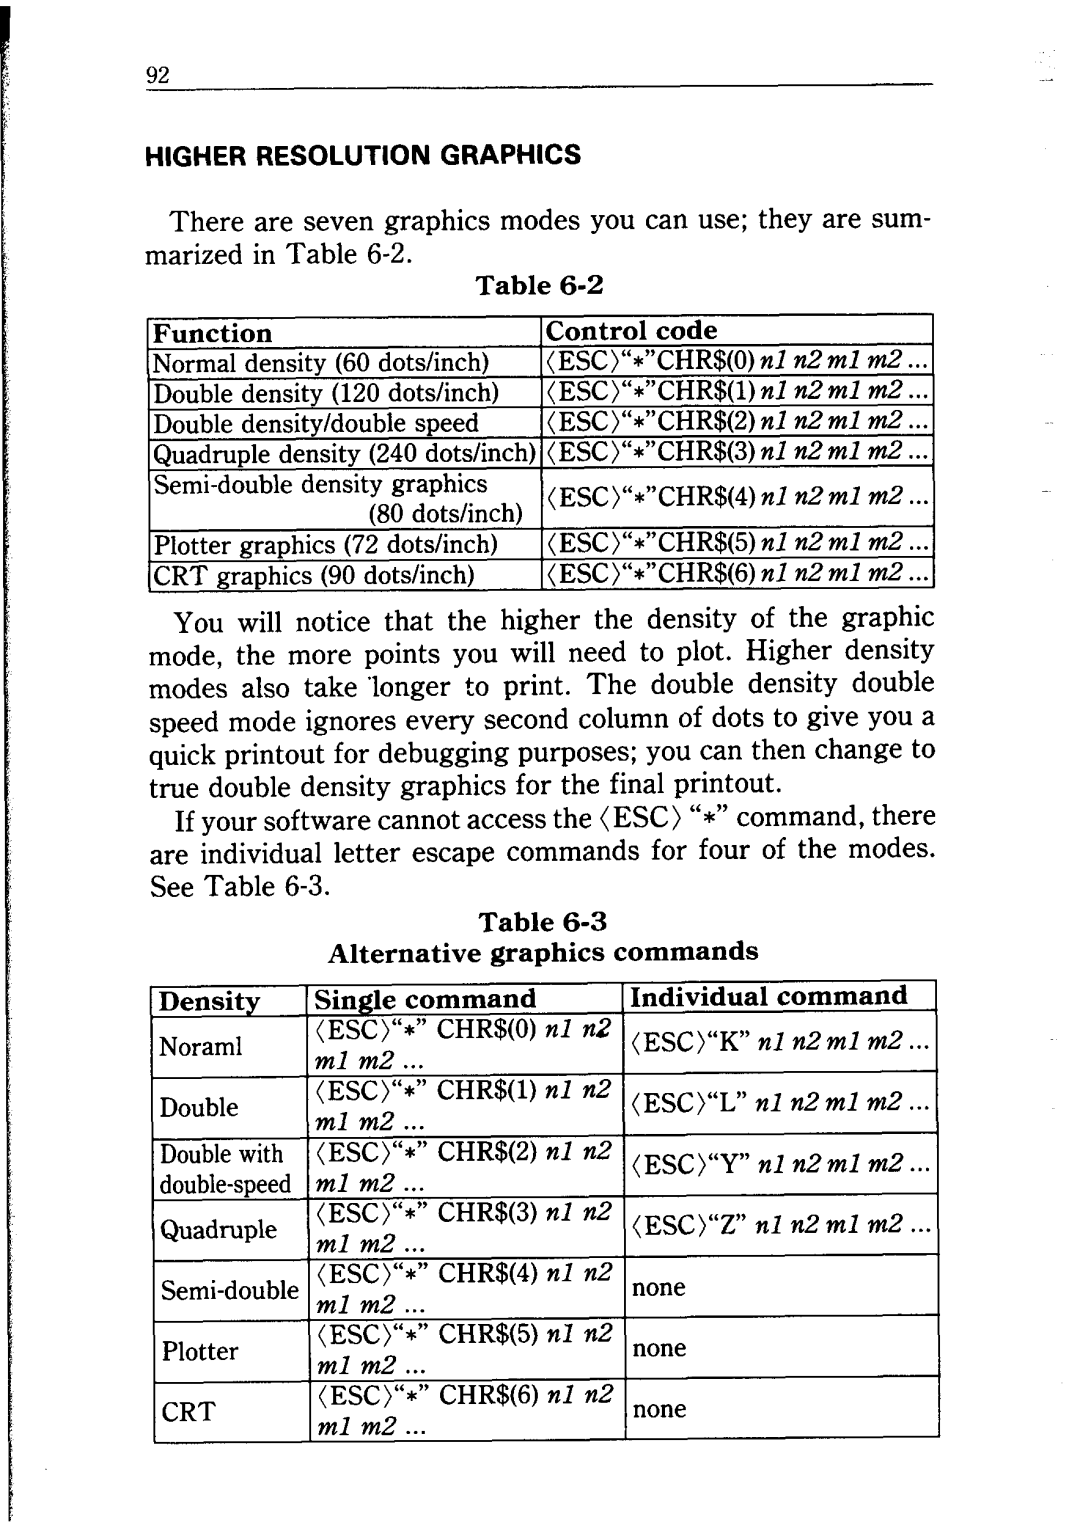
There are seven graphics modes you can use; they are sum- marized in Table
Table
Function
Normal density (60 dots/inch) Double densitv (120 dots/inch) Double
Quadruple
Control code
(ESC)“*“CHR$(O) nl n2 ml m2 ...
(ESC)“*“CHR$(l) nl vL?ml m2 ...
11m2 ...
(ESC)“z”CHR$(3) :l n2 ml m2
(8u aot
Plotter graphics (72 | I<ESCj”*“CHR$iGj nl n2ml m2 ...I |
CRT graphics (90 dots/inch) |
You will notice that the higher the density of the graphic mode, the more points you will need to plot. Higher density modes also take longer to print. The double density double speed mode ignores every second column of dots to give you a quick printout for debugging purposes; you can then change to true double density graphics for the final printout.
If your software cannot access the (ESC) “*” command, there are individual letter escape commands for four of the modes. See Table
Table
Alternative graphics commands