User’s Guide
Page
Indications for Use
Page
Glossary of Symbols
How to Use this Guide?
Table of Contents
Appendix C FCC Compliance Information
Clean Your System 128 Clean Your Transmitter
Review Reports and Edit Events 124 Enter Glucose Targets
Page
Getting Acquainted
Key Terms
Introduction
Getting Acquainted
How are the parts packaged?
Delivery
Key features of the System
Using your system
How do I prepare my system for the first time?
Important Things to Remember About System Calibration
Important Things to Remember About System Calibration con’t
Before You Get Started con’t
Helpful health related information
Hypoglycemia unawareness can develop for several reasons
Symptoms of Hypoglycemia Unawareness
Your FreeStyle Navigator system operates in two modes
Continuous Monitoring Mode Glucose CM
Blood Glucose Mode Glucose BG
Install or Replace Transmitter and Receiver Batteries
Key Terms
Install or Replace Transmitter and Receiver Batteries
Install or Replace the Transmitter Battery
If the display is
Check your work
Reconnect the Receiver to the Transmitter
Set the Time and Date
Key Terms
First time you use your FreeStyle Navigator system
When you install new batteries
Set the Time and Date
Go to the Main screen
Set the time
Go to the System screen
Select Set Date/Time from the System Menu screen
Set the date
Customer Care
Perform a Control Solution Test
Key Terms
Perform a Control Solution Test
Prepare test strip
Verify that your FreeStyle Control Solution is current
Numbers do not match
Insert test strip into the receiver
Compare code numbers
Numbers match
Confirm that you used a control solution
Apply control solution
Falls Outside
Evaluate the test results
Falls Within
Customer Care
Insert or Remove Your Sensor
Key Terms
Every 5 days after that
Insert or Remove Your Sensor
Insert your sensor
Decide what to do
Remove the sensor
Select an insertion site
End sensor session
Reconnect the receiver to Transmitter
An infection could occur
Prepare the insertion site
Remove the sensor delivery Unit from package
Remove the protective liner from the sensor support mount
Inserting the sensor on your abdomen
Attach the sensor delivery unit to your skin
Ensure that the adhesive pad is adhered to your skin
Inserting the sensor on the back of your arm
Remove inserter
Remove the locking pin
Insert sensor
Check the sensor support mount
IfThen
Discard the sensor inserter Safely
Customer Care
Attach Your Transmitter
Key Terms
Attach Your Transmitter
Yes
Attach the transmitter to the sensor support mount
Enter the sensor code into your receiver
Apply an over-bandage Optional
Steps Do This
Calibrate Your System/Test Blood Glucose Manually
Key Terms
Sterile lancets Sharps container
Calibrate Your System/Test Blood Glucose Manually
Insertion at night
Helpful Information con’t
Calibrate Your System/Test Blood Glucose Manually
IfThen
You are simply doing a manual
Select a test site
Important Do not touch the exposed needle on the lancet
Prepare for lancing
FreeStyle Lancing Device offers four different depth
Prepare for lancing. con’t
Finger
Your forearm
To lance your forearm clear cap
Lance the site
To lance your finger grey cap
Use test strips more than once. Discard used test strips
You get an error message
Test the sample
Do Not
Interpret the blood glucose results
Confirm you didnot use Control Solution
Discard the lancet
Remove and discard the test strip
Customer Care
Set, Review, or Change the Alarm Settings
Key Terms
Set, Review, or Change the Alarm Settings
About Glucose Alarms
About Glucose Alarms con’t
Access the Alarms menu From the Main menu
Alarm type Setting
Set, review, or change the Low Glucose alarm
Alarm on or off Your threshold value
Alarm on or off Your threshold value Alarm type Setting
Set, review, or change the High Glucose alarm
Medium
Set, review, or change your Projected Low glucose alarm
Sensitivity to
High
Set, review, or change your Projected High glucose alarm
Use the UP/DOWN Arrow buttons to highlight Data
Set, review, or change the Data Loss alarms
Alarm on or off Alarm type Setting
Set System Alarms
Set Progress Tones
You want to mute alarms
Return to the main menu
Mute all audible alarms for Hour
Daily Use
Key Terms
Purpose Start
Daily Use
Reconnect the receiver to the transmitter
If you want to Then go to this Step
Interpret the CM screen
Description
Interpret the icons
This Icon Means
Second
Turn the Backlight on
Customer Care
Respond to Alarms, Errors, and Problems
Key Terms
Can be muted
Alarms are alphabetized in the following tables
Must never be ignored
Cannot be muted
Status Information
Er1
Transmitter failure Sensor is expired
System is not producing continuous
This is normal for new sensors before
Respond to alarm message con’t
Cal Required Redo BG
Select Link. If the transmitter ID that appears on
If this message appears and you did not insert
System has detected a new sensor
Respond to alarm message con’t
Replace the sensor within the next 2 hours see
Respond to alarm message con’t
Er4
Er1
Er2
Er3
Calibration
Connection
Receiver will not turn on
Then
There is no glucose value on the screen
Skin irritation at sensor insertion site
Discomfort when inserting the sensor
Then
END of Section
Add Events
Key Terms
Add Events
Access the Add Event screen from the Main menu
Record meal events
Select the type of event you want to record
Type Aerobics, Walking, Jogging, Running
Record insulin events
Record state of health events
Record exercise events
Your glucose levels
Record generic events
Review Reports and Edit Events
Key Terms
To edit event history
Access the Reports menu from the Main menu
Review Reports and Edit Events
Set your glucose targets
Decide what you want to do
View a line graph of your glucose level history
If you want to
View a statistical summary of your glucose levels
Percentage of readings that are
Select the desired statistical reading
Your average glucose reading
How well you are maintaining your
Review or change your event history
Review/edit your
All BG measures are displayed
Interpret your events
Edit the event
Clean Your System
Receiver Transmitter Contact Points
Every time you change your sensor transmitter
Clean Your System
Clean your receiver
Clean your transmitter
Clean your receiver skin
Link and Unlink Your Transmitter and Receiver
Key Terms
BG Mode CM Mode Link/Unlink Receiver Transmitter
Link and Unlink Your Transmitter and Receiver
When you replace either your transmitter or your receiver
Unlink your receiver from your transmitter
If you want to
Are not
Link your receiver to your transmitter
Customer Care
Reset User Settings
Customer Care
Access the System menu from the Main menu
Reset User Settings
Settings screen
Access the Reset User
Reset your settings
Change Country Settings
Key Terms
Materials
Change Country Settings
None of the above
Access the Country Settings menu
Change the Language
Change the Time Format
Change the Date Format
Change the Decimal Format
Appendix a Site Maintenance
Appendix a
Introduction
Customer Care
Appendix B Specifications
Appendix B
System Specifications
3rd calibration Must be performed between 12
Appendix B Specifications con’t
Days of normal use including continuous glucose
1st calibration Must be performed at approximately
Performance Characteristics
Accuracy
155
Glucose mg/dL Performance
Performance Relative to the Reference YSI
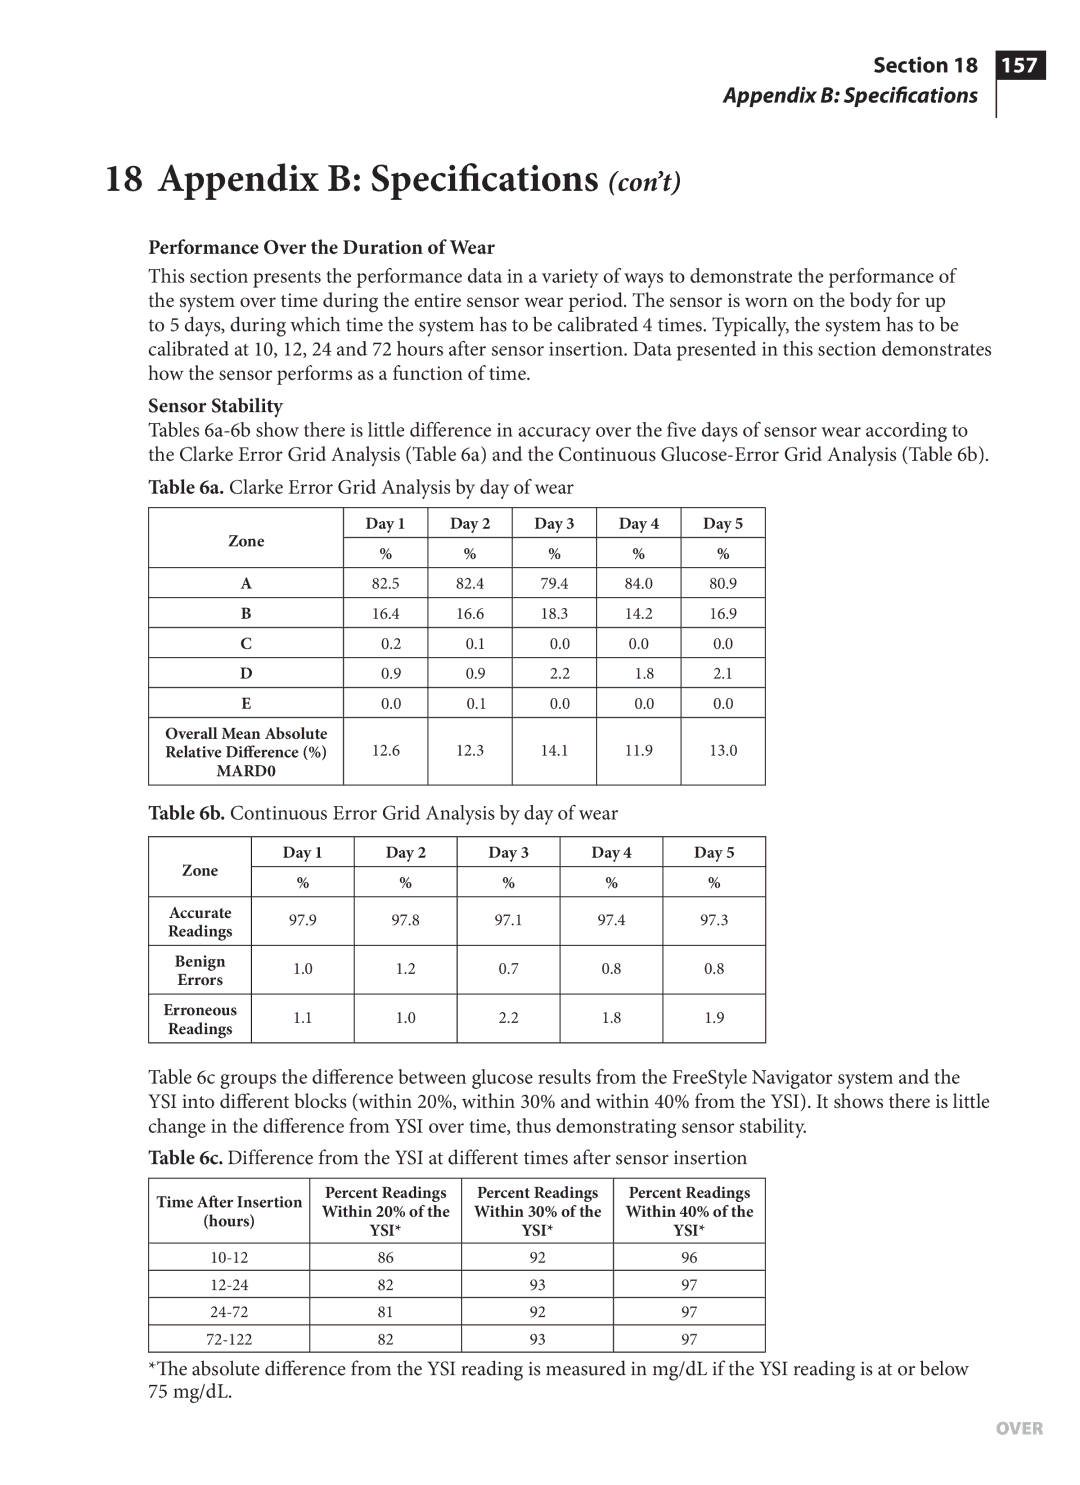
Sensor Stability
Performance Over the Duration of Wear
Sample Glucose Traces
Stability of Sensor Calibration
Sample of a Representative ‘Excellent’ Glucose Trace
Definitions
Determination of Alarm Performance
Detection of Low Glucose
Measuring Glucose in Interstitial Fluid
Appendix C FCC Compliance Information
Customer Care
Appendix C Classification/Compliance/Declaration
Compliance Level
Appendix C FCC Compliance Information con’t
Immunity test Test Level
Electromagnetic Environment- Guidance
Input lines 40% Ut* for 5 cycles Battery Operated
168
Applicable to the frequency of the transmitter
Classification
Declaration of Conformity
Customer Care
Glossary
Appendix C Classification/Compliance/Declaration
Glossary
2020Glossary
Continuous
Glossary con’t
177
178
179
180
Index
Customer Care
Index
2121Index
Index con’t