3.19 Viewing Statistics
Viewing statistics on a regular basis allows you to evaluate your network’s performance. You can view current statistics for the switch on a
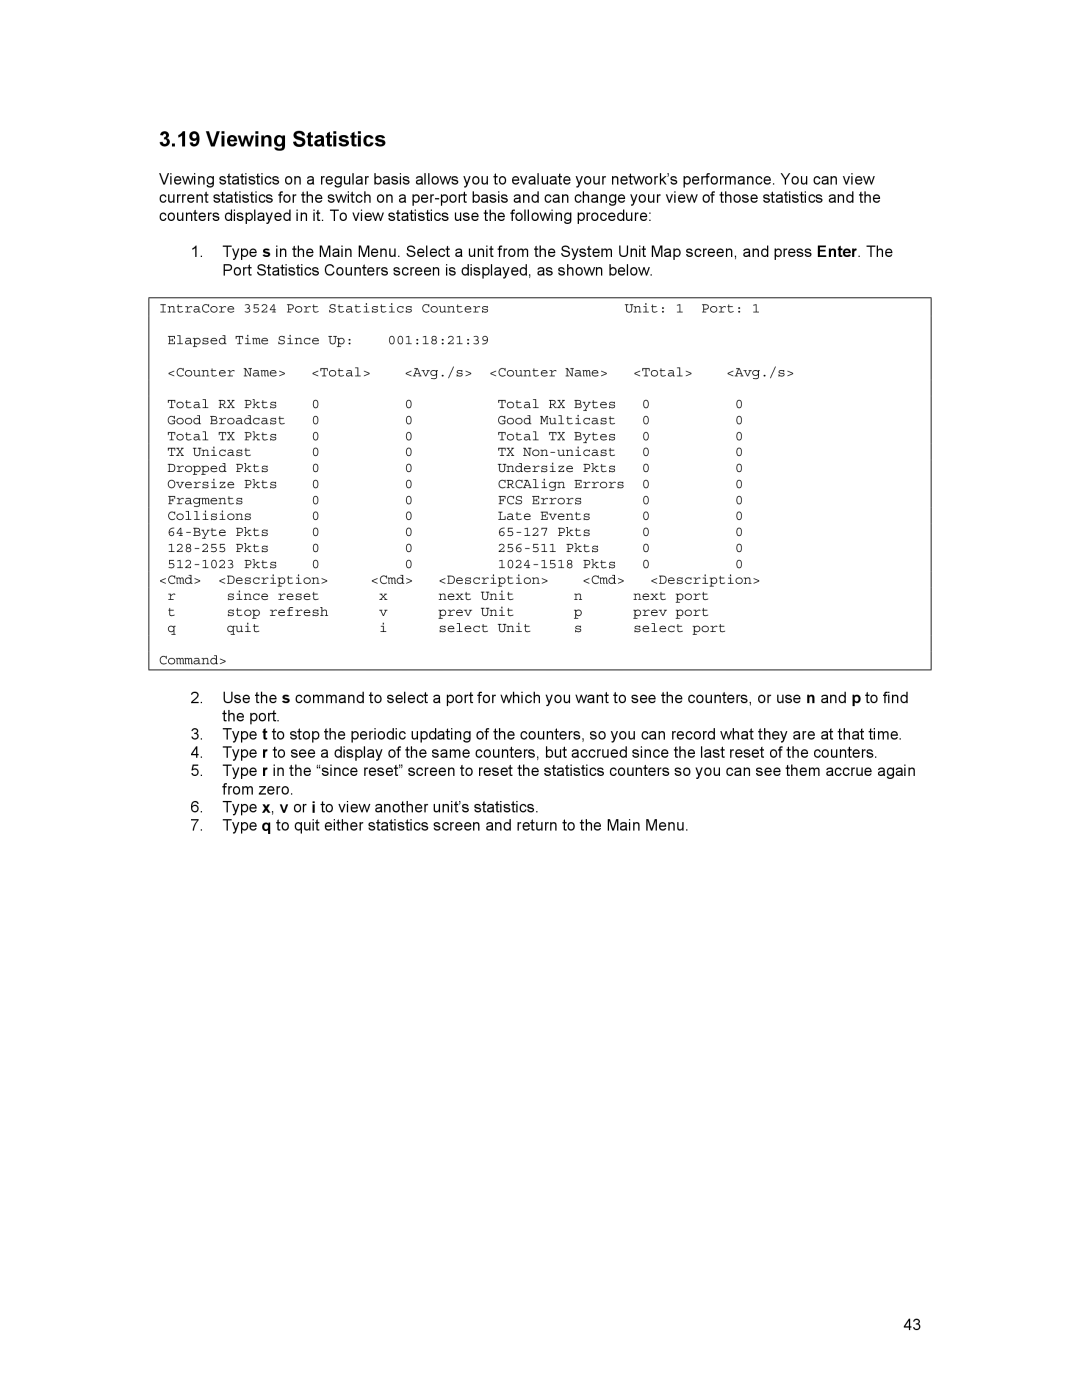
1.Type s in the Main Menu. Select a unit from the System Unit Map screen, and press Enter. The Port Statistics Counters screen is displayed, as shown below.
IntraCore | 3524 Port | Statistics Counters |
| Unit: 1 | Port: 1 | ||
Elapsed Time Since Up: | 001:18:21:39 |
|
|
| |||
<Counter Name> | <Total> | <Avg./s> | <Counter Name> | <Total> | <Avg./s> | ||
Total RX Pkts | 0 |
| 0 | Total RX Bytes | 0 | 0 | |
Good Broadcast | 0 |
| 0 | Good Multicast | 0 | 0 | |
Total TX Pkts | 0 |
| 0 | Total TX Bytes | 0 | 0 | |
TX Unicast | 0 |
| 0 | TX | 0 | 0 | |
Dropped Pkts | 0 |
| 0 | Undersize Pkts | 0 | 0 | |
Oversize Pkts | 0 |
| 0 | CRCAlign Errors | 0 | 0 | |
Fragments |
| 0 |
| 0 | FCS Errors | 0 | 0 |
Collisions | 0 |
| 0 | Late Events | 0 | 0 | |
0 |
| 0 | 0 | 0 | |||
0 |
| 0 | 0 | 0 | |||
0 |
| 0 | 0 | 0 | |||
<Cmd> | <Description> | <Cmd> | <Description> | <Cmd> | <Description> |
r | since reset | x | next Unit | n | next port |
t | stop refresh | v | prev Unit | p | prev port |
q | quit | i | select Unit | s | select port |
Command>
2.Use the s command to select a port for which you want to see the counters, or use n and p to find the port.
3.Type t to stop the periodic updating of the counters, so you can record what they are at that time.
4.Type r to see a display of the same counters, but accrued since the last reset of the counters.
5.Type r in the “since reset” screen to reset the statistics counters so you can see them accrue again from zero.
6.Type x, v or i to view another unit’s statistics.
7.Type q to quit either statistics screen and return to the Main Menu.
43